Figures & data
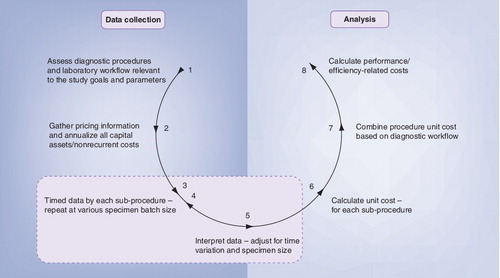
This diagram provides a step by step plan for cost analysis in evaluating TB diagnostic tests in various study settings. Steps 3, 4 and 5 should be undertaken for all the methods evaluated and relevant sub-procedures and repeated to capture data variations caused by specimen loads (and/or specimen batch size). In step 7, the investigator should consult laboratory experts regarding diagnostic workflow to reflect local laboratory practice in combining procedure unit costs.
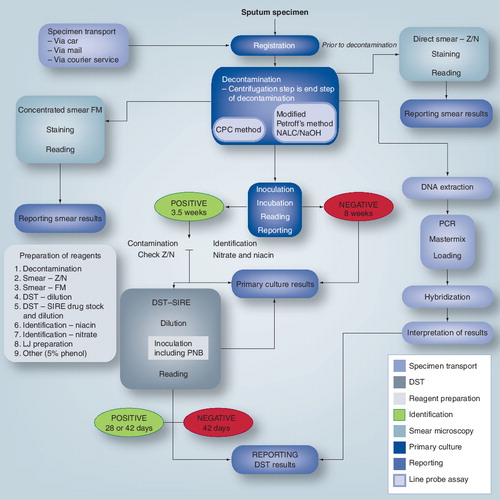
When first planning for a costing study, evaluating diagnostic workflow is essential in capturing all aspects of laboratory activities that need to be evaluated for costs. Shown is a generalized workflow observed in a laboratory where molecular testing for MDR-TB using a line probe assay is being evaluated against the conventional culture method using LJ in a demonstration study. Actual workflow at different laboratories may vary.
CPC: Cetylpyridinium chloride; DST: Drug susceptibility testing; FM: Fluorescent microscopy; LJ: Löwenstein Jensen; MDR: Multidrug resistance; NALC: N-acetyl-L-cysteine; Z/N: Ziehl-Neelsen.
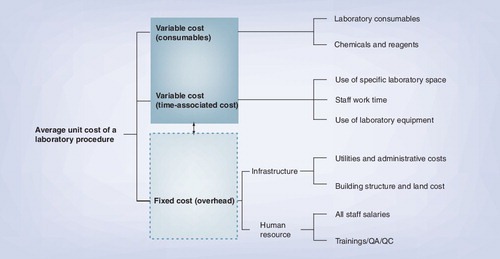
Costs associated with training/QA/QC are assessed independently as per activity cost and allocated into average unit cost based on staff timing associated with the relevant laboratory procedure. For example, test specific training/QA/QC (e.g., culture and molecular testing hands-on training) should be allocated only into test specific unit cost, where as period QA/QC for general laboratory activities should be allocated into all of the laboratory procedures/activities calculated for unit cost.
QA: Quality assurance; QC: Quality control.