Figures & data
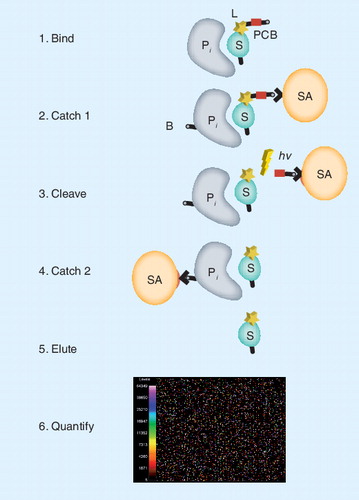
(Step 1) The specific protein to be measured (P i) binds tightly to its cognate SOMAmer binding molecule (S), which includes a PCB and fluorescent label (L) at the 5´ end. (Step 2) Bound protein–SOMAmer complexes are captured onto streptavidin coated beads (SA) by PCB on the SOMAmer. Unbound proteins are washed away. Bound proteins are tagged with biotin (B). (Step 3) The PCB is cleaved by UV light (hn) and the protein-SOMAmer complexes are released into solution. (Step 4) The protein–SOMAmer complexes are captured onto SA and the SOMAmers are eluted into solution (Step 5) and recovered for quantification in Step 6, hybridization to a custom DNA microarray. Each probe spot contains DNA with sequence complementary to a specific SOMAmer, and the fluorescent intensity of each probe spot is proportional to the amount of SOMAmer recovered, which is proportional to the amount of protein present in the original sample.
PCB: Photo-cleavable biotin; SOMAmer: Slow off-rate modified aptamer.
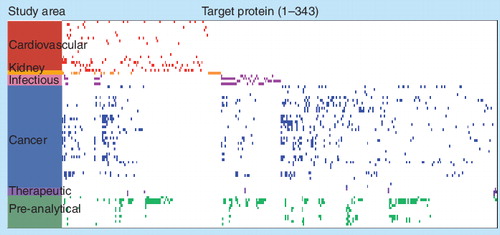
Each row represents one of 77 statistical comparisons of clinical serum or plasma samples (disease and matched controls) that address specific clinical questions in the study area indicated. Each column represents a unique protein measured with the SOMAscan proteomics discovery platform. A colored rectangle represents a potential biomarker for the respective comparison that met the following criteria in the statistical comparison: Kalmagorov–Smirnov (KS) test distance >0.3, KS test p-value < 0.01, KS distance rank in top 25 (highest), and p-value rank in top 25 (lowest). Ties in ranking were allowed, so more than 25 preliminary biomarkers are possible for each comparison. The map shows 334 of approximately 850 possible protein targets measured. The other approximately 500 proteins were not identified as potential biomarkers in the 77 experiments.
SOMAscan: Slow off-rate modified aptamers scan.