Figures & data
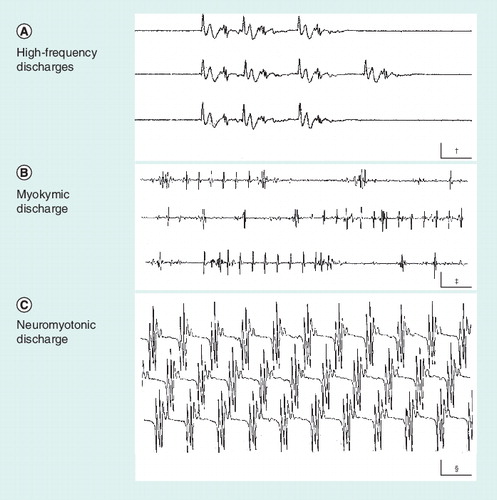
(A) High-frequency discharge. It usually results from an ectopic focus generating activity of neighboring hyperexcitable muscle fibers. (B) Myokymic discharge. Action potentials of a relatively simple shape, either isolated or repeating in groups at a stable frequency. (C) Neuromyotonic discharge. Complex action potentials that repeat with no variation, sometimes at a very high frequency. †Calibration is 10 ms × 0.2 mV.‡Calibration is 50 ms × 0.5 mV.§Calibration is 20 ms × 0.1 mV.
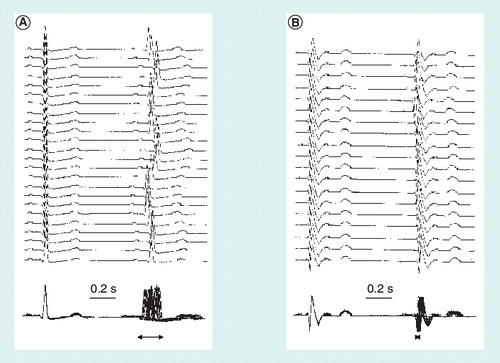
The top traces show the variation in latency of the second QRS complex with respect to the first and the bottom traces show the same recordings superimposed to better appreciate the ‘jitter’ of the second QRS complex (horizontal arrows) and the differences between (A) a healthy subject and (B) a patient with autonomic dysfunction in the context of Chagas disease.
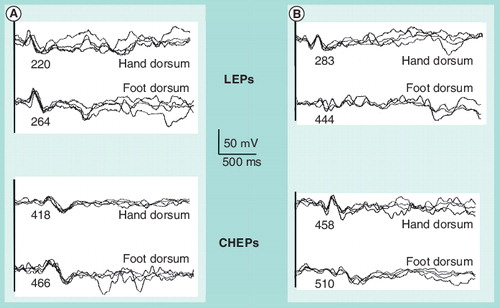
(A) In a healthy subject and (B) in a patient with axonal distal polyneuropathy. Numbers below each waveform express the peak latency in miliseconds.
CHEP: Contact heat-evoked potential; LEP: Laser-evoked potential.
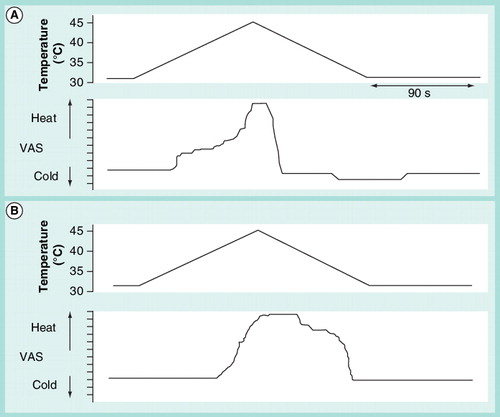
Subjects are requested to reproduce their sensations when a slow rise in temperature is applied to hands or feet. The upper graph is the temperature profile and the bottom graph the subjective reproduction of the sensations. Typically, patients with polyneuropathy show a delay in perception of warm and pain, remain marking pain for longer time than healthy subjects and do not mark any decrease in temperature below neutral (the temperature at onset), in the descent phase after the stimulus. (A) Healthy subject and (B) patient with mild-to-moderate diabetic polyneuropathy.VAS: Visual analogue scale.