
Figures & data
FIGURE 1. Spectral light environment of each treatment in relation to natural insolation; black solid line—sunlight, gray solid line—control, gray dotted line—UV exclusion. The total values shown represent the sum of total PFDs of the UV waveband (λ 280–400 nm) and the VIS waveband (λ 400–700 nm) in μmol m-2 s-1.
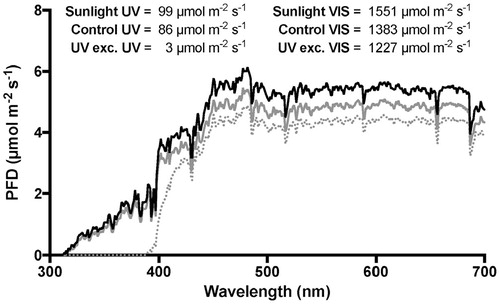
FIGURE 2. (top) Light saturated photosynthetic rates (A sat), (middle) light saturated stomatal conductance (gs), and (bottom) intrinsic water use efficiency (WUEi) of E. pauciflora, G. antrorsum, and P. hiemata under UVA+VIS wavelengths (λ > 320 nm). Filled bars represent the full sunlight treatment; dashed bars represent the UV exclusion treatment. Values are means ± SEM (n = 15). Asterisks indicate significantly different means (* P < 0.05, ** P < 0.01, *** P < 0.001) between light treatments, within species; upper-case letters denote significantly different means between species identified by Fisher's LSD test (P < 0.05).
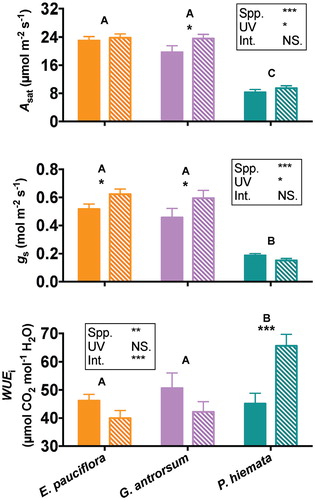
FIGURE 3. Effect of inclusion of UVA wavelengths on the light saturated photosynthetic rate (Asat) for E. pauciflora, G. antrorsum, and P. hiemata. Filled bars represent the full sunlight treatment; dashed bars represent the UV exclusion treatment. Values are means ± SEM (n = 15). Asterisks indicate significantly different means (* P < 0.05, ** P < 0.01, *** P < 0.001) between light treatments, within species; upper-case letters denote significantly different means between species identified by Fisher's LSD test (P < 0.05).
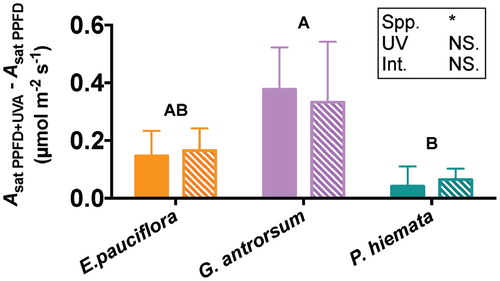
FIGURE 4. Mean fluorescence emission spectra for E. pauciflora, G. antrorsum, and P. hiemata. Excitation wavelength was 380 nm. Black lines represent the full sunlight treatment; gray lines the UV exclusion treatment. Values represent means ± SEM (dashed lines) for n = 9.
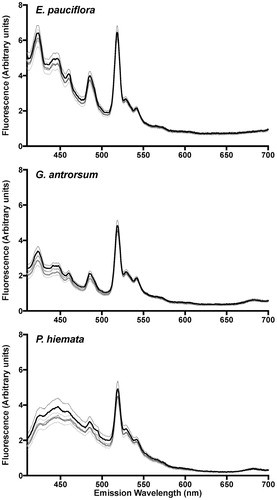
TABLE 1 Fluorescence emission peaks and ratios. Fluorescence emission peaks and peak ratios, using an excitation λ of 380 nm. Values represent means ± SEM for n = 9. Asterisks indicate significantly different means using a two-way ANOVA (* P < 0.05, *** P < 0.001). Different lowercase letters represent significantly different means between species by Fisher's LSD multiple comparison test (α = 0.05). Dot (•) indicates significantly different means between light treatments within species by Fisher's LSD multiple comparisons test (α = 0.05).
FIGURE 5. Spectral profiles of Chl a fluorescence for fresh leaves of E. pauciflora (orange), G. antrorsum (orchid), and P. hiemata (green). Values represent excitation of the Chl a emission peak at λ 685 nm for plants grown under (a) full sunlight, and (b) UV exclusion; and of the Chl a emission peak at λ 730 nm for plants grown under (c) full sunlight, and (d) UV exclusion. Data shown are means ± SEM for n = 9.
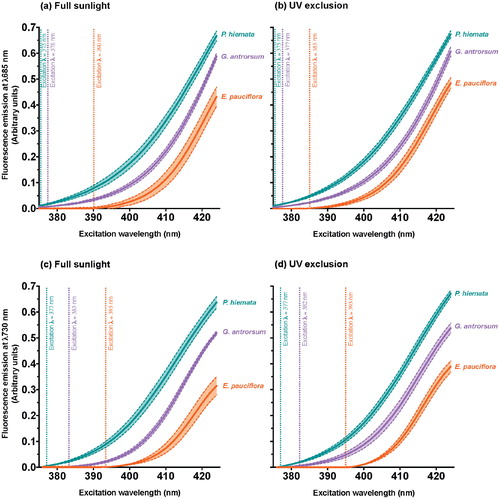
FIGURE 6. Microscopy images of E. pauciflora (top), G. antrorsum (middle), and P. hiemata (bottom) at 100× magnification. Images are from leaves grown in full sunlight.
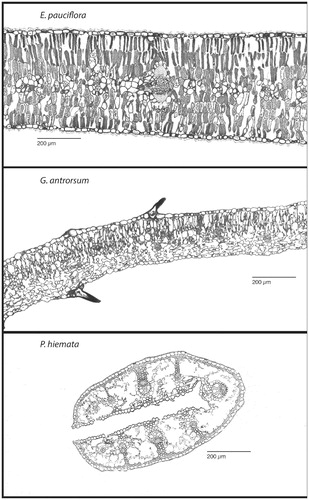
FIGURE 7. Total ascorbate concentration, dehydroascorbate concentration, ascorbate redox state (dehydroascorbate/total ascorbate), total glutathione concentration, GSSG concentration, and glutathione redox state (GSSG/total glutathione) in leaves of E. pauciflora, G. antrorsum, and P. hiemata. Filled bars represent the full sunlight treatment; dashed bars the UV exclusion treatment. Values are means ± SEM (n = 15). Asterisks indicate significantly different means (* P < 0.05, ** P < 0.01, *** P < 0.001) between light treatments, within species; upper-case letters denote significantly different means between species identified by Fisher's LSD test (P < 0.05).
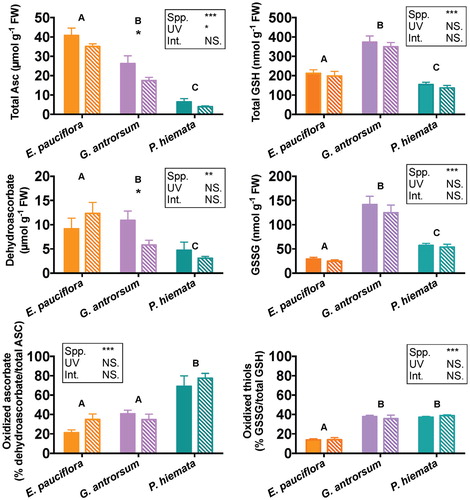
TABLE 2 Glutathione precursors. Concentrations of the glutathione precursors cysteine and γ-glutamylcysteine (γ-EC). Values represent means ± SEM for n = 15. Asterisks indicate significantly different means using a two-way ANOVA (*** P < 0.001). Different lowercase letters represent significantly different means between species by Fisher's LSD multiple comparison test (α = 0.05).