
Figures & data
Figure 1 Description of the multi-step process used in determination of the MBDA score algorithm.
Abbreviations: BRASS, Brigham and Women’s RA Sequential Study; CAMERA, Computer Assisted Management in Early RA; InFoRM, Index for RA Measurement-Crescendo Bioscience Study; Leiden, Leiden Early Arthritis Cohort; MBDA, multi-biomarker disease activity; OKC, Oklahoma City Community Cohort; DAS28, 28-joint disease activity score; CRP, C-reactive protein; RA, rheumatoid arthritis; DA, disease activity.
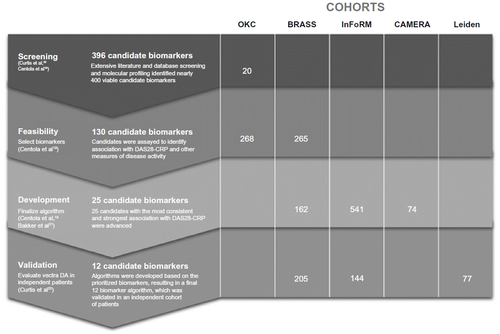
Table 1 Clinical characteristics of patients based on classification of disease activity by multi-biomarker disease activity score in validation studies
Table 2 Cross-sectional correlations with additional clinical disease activity measures for the MBDA score and CRPTable Footnotea
Figure 2 Relationship between the MBDA score and clinical disease activity indices. Correlation and linear regression of MBDA score with DAS28-ESR (A), SDAI (B), and CDAI (C).
Abbreviations: CDAI, clinical disease activity index; DAS28, 28-joint disease activity score; ESR, erythrocyte sedimentation rate; MBDA, multi-biomarker disease activity; SDAI, simple disease activity index.
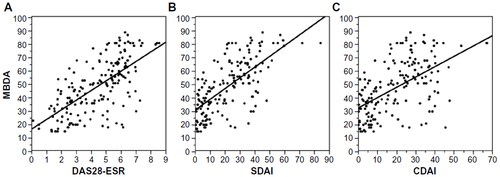
Table 3 Ratios of median disease activity measuresTable Footnotea between RA patients with and without common comorbidities
Figure 3 MBDA scores by treatment arm and time point.
Abbreviations: MBDA, multi-biomarker disease activity; MTX, methotrexate.
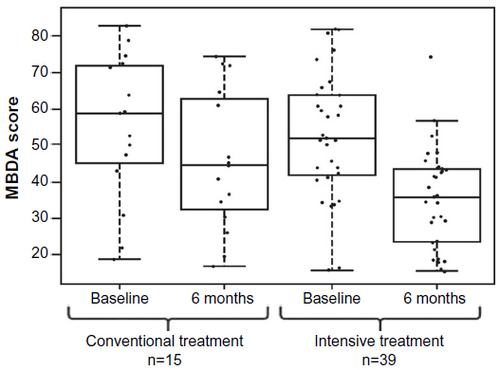
Figure 4 Changes (Δ) in MBDA score by EULAR response at week 52.
Abbreviations: BL, baseline; EULAR, European League Against Rheumatism; IQR, interquartile range; MBDA, multi-biomarker disease activity; TNF, tumor necrosis factor.
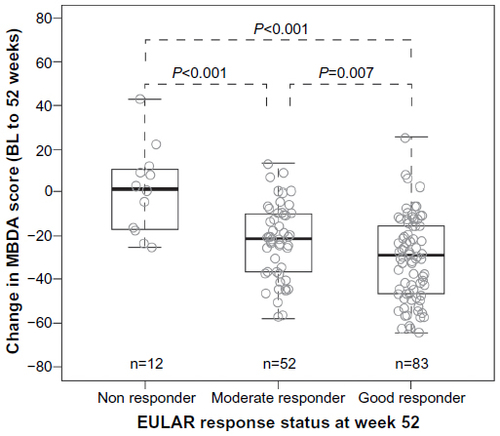
Figure 5 Probability plots of radiographic progression at year 1 for high, moderate, and low disease activity patient (n=235) grouped according to baseline MBDA (A), CRP (B), DAS28 (C), and ESR (D).
Abbreviations: CRP, C-reactive protein; DA, disease activity; DAS28, 28-joint disease activity score; ESR, erythrocyte sedimentation rate; MBDA, multi-biomarker disease activity; SHS, Sharp-van der Heijde score.
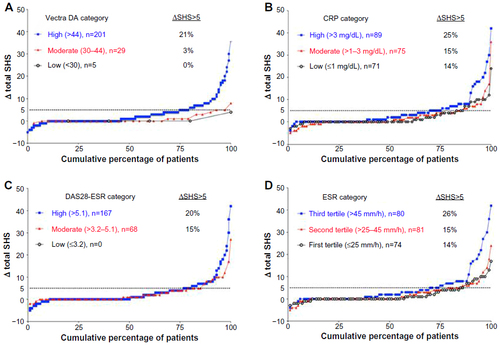
Table S1 Twelve biomarkers reflect the heterogeneity of RA