Figures & data
Figure 1 The histology of control and near-infrared (NIR) irradiated skin (×200 magnification). The left column shows Azan-Mallory staining, the middle column shows type I collagen staining, and the right column shows type III collagen staining. Images from top to bottom show control, postirradiation day 30 (P30), postirradiation day 45 (P45), postirradiation day 180 (P180). Scale bar = 50.0 μm.
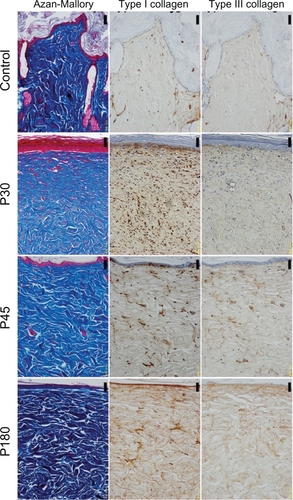
Figure 2 The histology of scar tissues (×200 magnification). The left column shows Azan-Mallory Staining, the middle column shows type I collagen staining, and the right column shows type III collagen staining. Images from top to bottom show postinjury day 7 (P7), postinjury day 30 (P30), postinjury day 45 (P45), postinjury day 180 (P180). Scale bar = 50.0 μm.
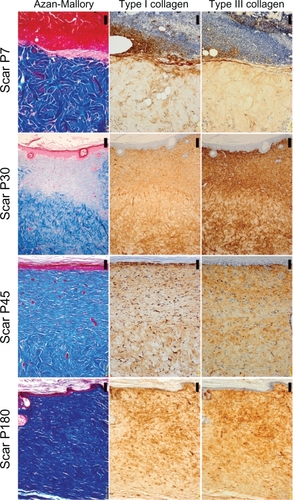
Figure 3 The histology of control, near-infrared (NIR) irradiated tissues, and scar tissues with hematoxylin and eosin staining (×400 magnification). The left column shows control skin and NIR irradiated skin, and the right column shows scar tissues. Images from top to bottom show control, P7, P30, P45, and P180. Scale bar =20.0 μm.
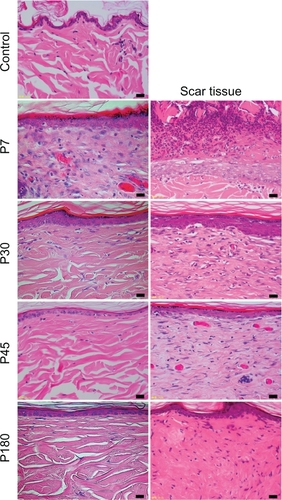
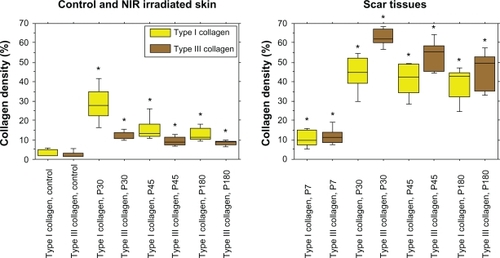
Figure 4 The percentages of type I collagen (yellow), and type III collagen (brown). Left: the results of control, and near-infrared (NIR) irradiated skin, right: the results of scar tissues.