Figures & data
Figure 1 (A) Mean values and SDs of the fat thickness assessment by diagnostic ultrasound before treatment (baseline) and after treatment (after 15 days). *Statistically significant difference (P<0.05). Comparative panoramic images of the buttocks and the posterior thighs in (B) G1 and (C) G2 groups. Note the hyperechoic areas: bright echoes, highly reflective structures (white = dermis and fibrotic septa) and hypoechoic areas: sparse echoes, reflection or intermediate transmission (gray = adipose tissue and skeletal muscle). The points (+) indicate the areas compared and the decrease in thickness and density of the fibrotic septa after treatment.
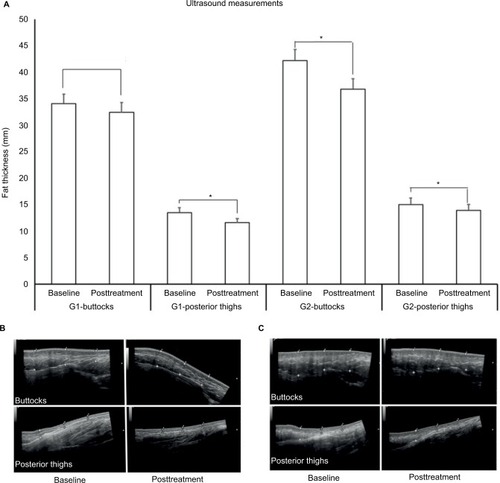
Table 1 Baseline characteristics of the study participants
Table 2 Clinical characteristics of the study population at baseline and posttreatment (age, weight, BMI, circumference of the buttocks)
Figure 2 (A) Mean values and SDs of the cellulite degree evaluation according to the generally accepted classification of cellulite at baseline (before) and 15 days after the last session. *Statistically significant difference (P<0.05). Comparative photographic representation showing clinical improvement of the buttocks and posterior thighs in (B) G1 and (C) G2 at baseline and posttreatment.
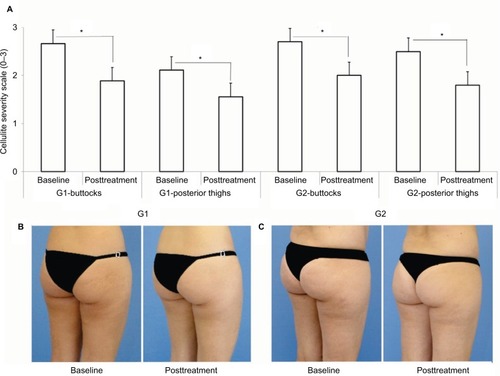
Table 3 Values of the R0 (skin firmness) in baseline and posttreatment in G1 and G2
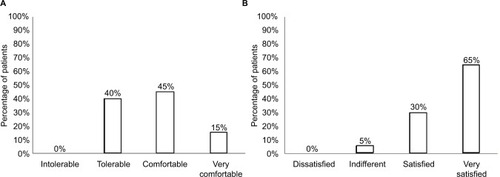
Figure 3 (A) Volunteer satisfaction with treatment: 1- dissatisfied, 2- indifferent, 3- satisfied and 4- very satisfied. (B) Volunteer tolerance to treatment: 1- intolerable, 2- tolerable, 3- comfortable and 4- very comfortable.