Figures & data
Figure 1 Structure of the pseudo-ceramide (cetyl PG hydroxyethyl palmitamide) used in this study.
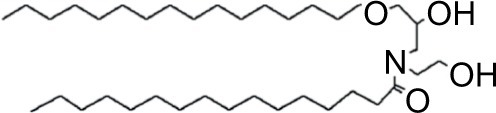
Figure 2 The scalp was divided into 23 areas for the assessment of symptoms that were rated on a scale of 1–4.
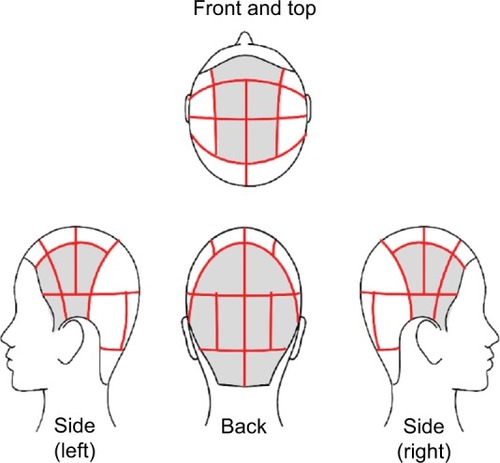
Figure 3 Changes in daily temperature and relative humidity during the evaluation period.
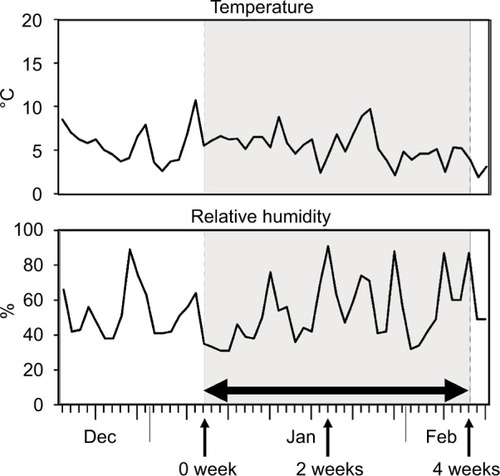
Figure 4 Differences in the severity of scaling (A) and erythema (B) at week 0 in the scalp region.
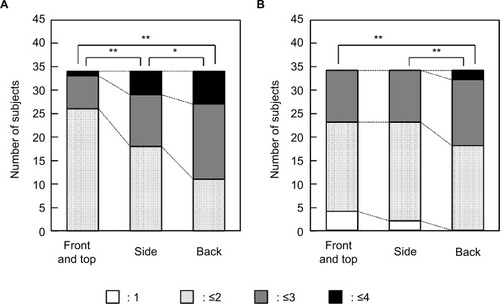
Figure 5 Typical clinical features at weeks 0 and 4.
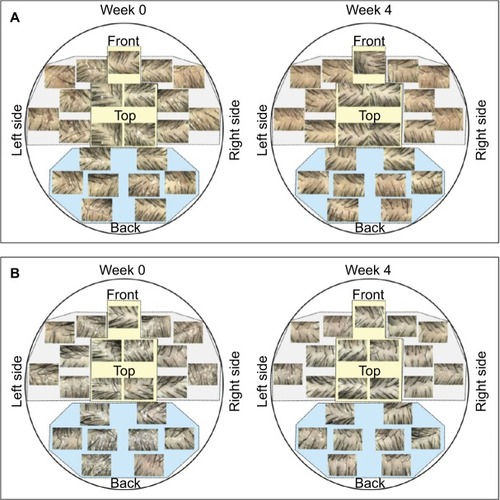
Table 1 Dryness, scaling, erythema, and itchiness on the scalp of subjects with AD or SD/PC at weeks 0, 2, and 4
Figure 6 Itchiness evaluated by VAS at weeks 0, 2, and 4. 0 mm indicates no itch and 100 mm represents a maximum intensity of itch.
Abbreviation: VAS, visual analog scale.
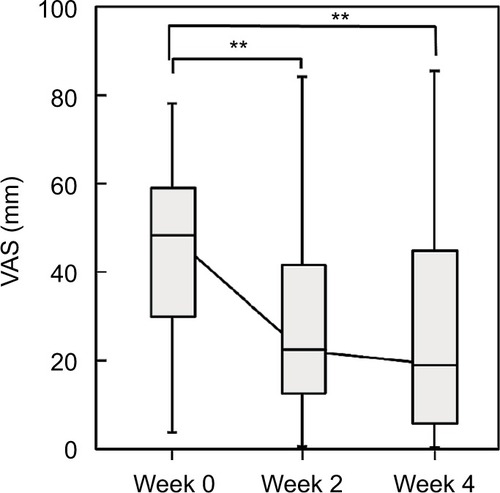
Figure 7 MRA (A) and TEWL (B) on the scalp at weeks 0, 2, and 4.
Abbreviations: MRA, moisture-retention ability; TEWL, transepidermal water loss.
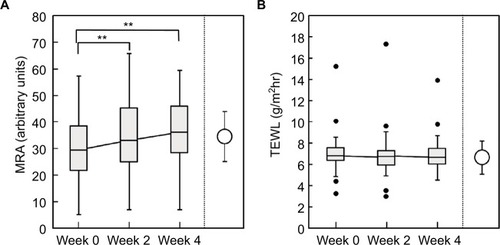
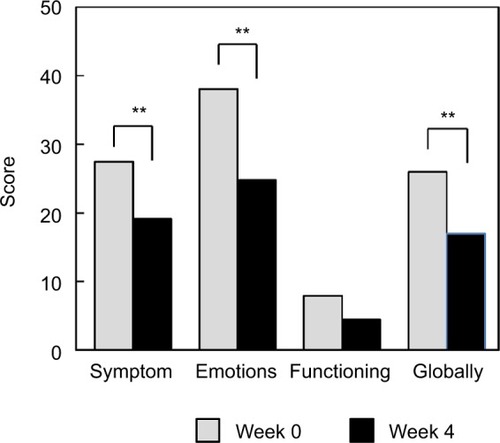
Figure 8 QoL evaluated by the Skindex-16® at weeks 0 and 4.
Abbreviation: QoL, quality of life.