Figures & data
Figure 1 The three panoramic radiographs show the large variation in bone mass, trabeculation, and basal cortex in persons 79- or 80-years-old.
Notes: (A) Shows a male with dense trabecular bone and thick basal compacta, (B) a female with sparse trabecular bone and thin eroded compacta, and (C) an old edentulous female with extremely resorbed alveolar process.

Figure 2 The radiograph is of a 48-year-old osteoporotic female. The trabecular network is disrupted in two locations around the second premolar.
Notes: The vertical trabeculae have disappeared, whereas the horizontal ones have been reinforced.
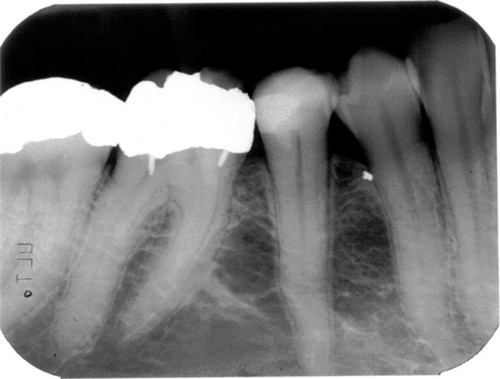
Figure 3 Visual index for assessment of cortical shape.
Notes: Reference images presenting dense trabeculation and a normal mandibular cortex with even and sharp endosteal margin (A), mixed trabeculation, and a moderately eroded cortex with endosteal margin showing semilunar defects (B), sparse trabeculation, and severely eroded cortex, with the cortical layer being clearly porous (C).
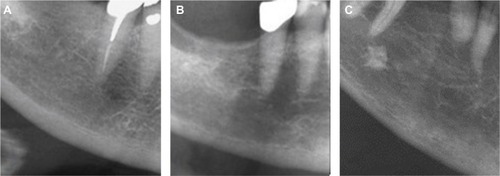
Figure 4 Visual index for assessment of trabecular bone.
Notes: Reference images presenting the trabecular pattern as sparse trabeculation in females with: large intertrabecular spaces (A); mixed dense plus sparse trabeculation with small intertrabecular spaces cervically and larger spaces more apically (B); and dense trabeculation with small intertrabecular spaces (C).
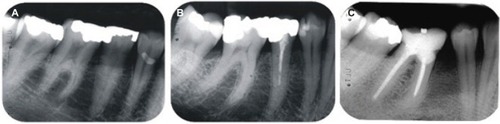
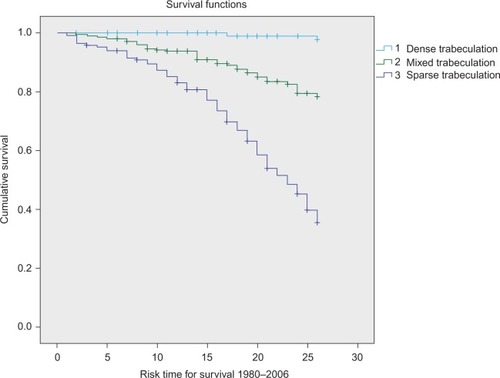
Figure 5 Kaplan–Meier survival curve showing cumulative “fracture” survival and risk time for fracture in three different trabeculation groups.
Notes: 1) Survival of women with dense trabeculation, 2) mixed trabeculation, and 3) sparse trabeculation. Risk time represents the time interval between baseline assessment and fracture event. All participants included (n=518), started “fracture-free” at baseline (1980) and experienced 136 first, incident fractures during the period 1980–2006.