Figures & data
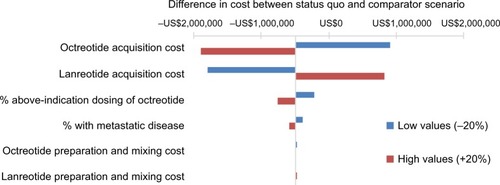
Figure 1 Model schematic.
Notes: The model schematic shows the flow of patients through the model for the two scenarios. In each scenario, those eligible for somatostatin analogs are treated with either lanreotide or octreotide. For each treatment, patients accrue costs based on the product acquisition and administration costs, which take into account dosing and the impact of failed injections. Total costs are estimated for each scenario, and compared to assess the costs of shifting utilization.
Abbreviation: GEP-NETs, gastroenteropancreatic neuroendocrine tumors.
Abbreviation: GEP-NETs, gastroenteropancreatic neuroendocrine tumors.
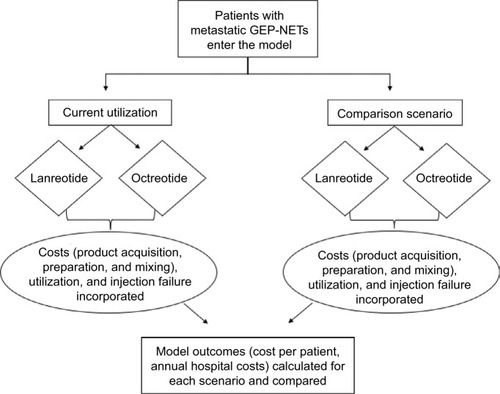
Table 1 Model population and cost parameters
Table 2 Product utilization parameters
Table 3 Base case resultsTable Footnotea,Table Footnoteb
Figure 2 Sensitivity analysis results: tornado diagram.
Notes: The sensitivity analysis tornado diagram indicates the impact of parameter uncertainty on the model outcomes. Each horizontal bar shows the range of differences in costs of the comparator scenario compared with the status quo scenario when varying a given parameter by ±20%. As depicted, the parameter with the greatest impact on model results was product acquisition costs, followed by the proportion of patients getting above-indicated dosing of octreotide.