
Figures & data
Table 1 Duration and distribution of subsequent treatments considered
Figure 1 State diagram of the three health states considered.
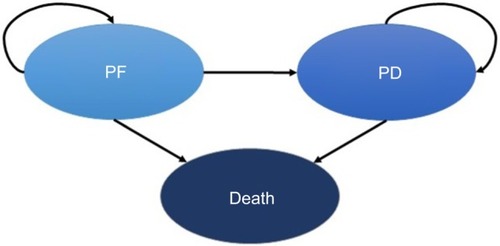
Table 2 Efficacy, safety, and quality of life parameters considered
Table 3 Economic parameters considered
Table 4 Base case and univariate sensitivity analysis
Figure 2 Ad hoc sensitivity analysis results.
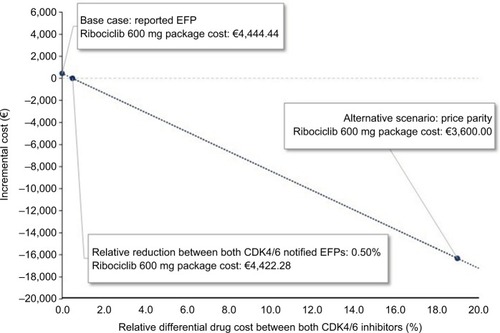
Figure 3 Probabilistic sensitivity analysis results (without price parity between the two CDK4/6 inhibitors), represented through an incremental cost-utility plane (A) and a cost-effectiveness acceptability curve (B)
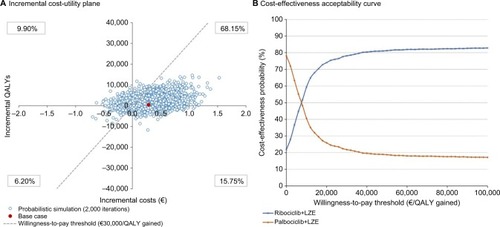
Figure 4 Probabilistic sensitivity analysis results (with price parity between the two CDK4/6 inhibitors), represented through an incremental cost-utility plane (A) and a cost-effectiveness acceptability curve (B)
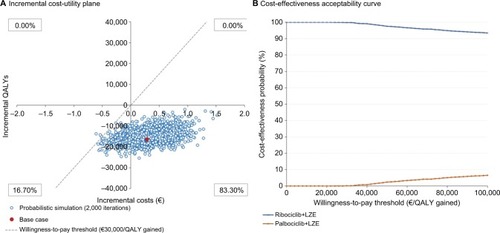
Figure S1 Fit of the parametric distributions to the latest KM plots for PFS in MONALEESA-2 of letrozole monotherapy group (reference arm) with model extrapolation over a 20-year time horizon (240 months).
Abbreviations: KM, Kaplan–Meier; PFS, progression-free survival.
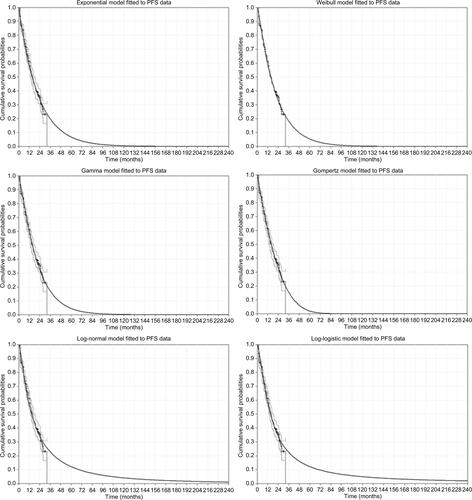
Figure S2 Fit of the parametric distributions to the latest KM plots for OS in MONALEESA-2 of letrozole monotherapy group (reference arm) with model extrapolation over a 20-year time horizon (240 months).
Abbreviations: KM, Kaplan–Meier; OS, overall survival.
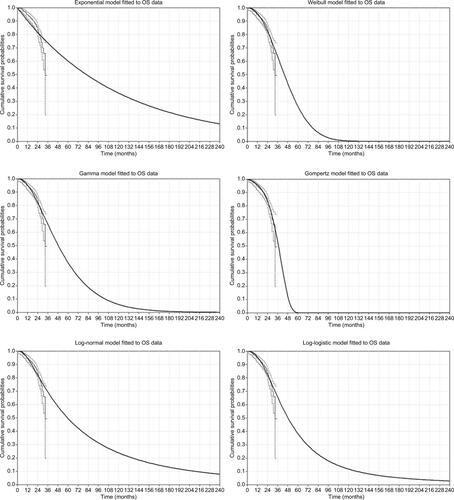
Table S1 Details on goodness of fit with the KM curves and survival rates of letrozole monotherapy from MONALEESA-2 study (reference arm)
Table S2 Detail of the economic parameters considered in the probabilistic sensitivity analysis\