
Figures & data
Table 1 Demographics/characteristics of MONARCH sarilumab and adalimumab patient populations (base case analysis) and MOBILITY aggregate patient population (individual patient simulation)
Table 2 Treatment response rates applied to short-term and long-term models
Figure 1 Model structure for long-term analysis.
Abbreviations: AE, adverse event; csDMARD, conventional synthetic disease-modifying antirheumatic drug; csDMARD-IR, inappropriate response or intolerance to csDMARDs/methotrexate; HAQ-DI, Health Assessment Questionnaire Disability Index; QALY, quality-adjusted life-year.
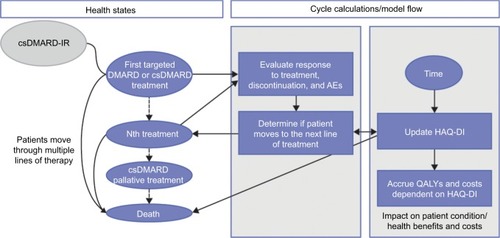
Table 3 Drug costs
Figure 2 Responders (%) and NNT.
Abbreviations: ACR, American College of Rheumatology; EULAR, European League Against Rheumatism; NNT, number needed-to-treat; Q2W, every 2 weeks; QW, once weekly; SC, subcutaneous.
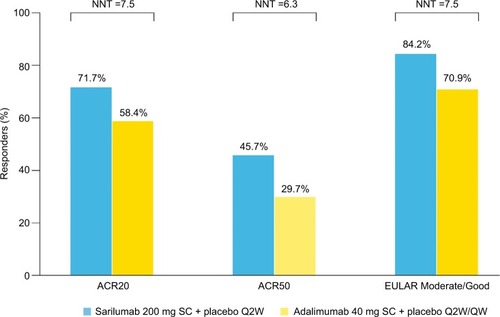
Figure 3 Cost per responder at 24 weeks: (A) base case analysis and (B) sensitivity analyses.
Abbreviations: ACR, American College of Rheumatology; EULAR, European League Against Rheumatism; Q2W, every 2 weeks; QW, once weekly; SC, subcutaneous.
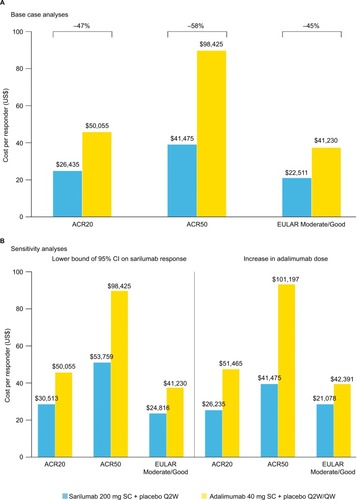
Figure 4 Long-term incremental analyses.
Abbreviations: BCS, best care/palliative treatment; ETA, etanercept; TOF, tofacitinib; QALY, quality-adjusted life-year; Y, year.
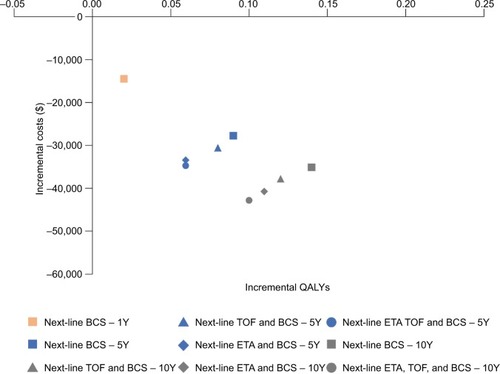
Table 4 Long-term analyses: costs
Table 5 Long-term analyses: outcomes