Figures & data
Table 1 Demographic and baseline characteristics of the study population (N=186)
Figure 1 Changes in average pain severity score measured on an 11-point NRS during the 60-day treatment with OXN-PR.
Notes: *P=0.02 T60 vs T30 result; **P<0.0001 T30 vs T15 result.
Abbreviations: NRS, numerical rating scale; OXN-PR, prolonged-release oxycodone/naloxone; T0, baseline; T15, day 15; T30, day 30; T60, day 60.
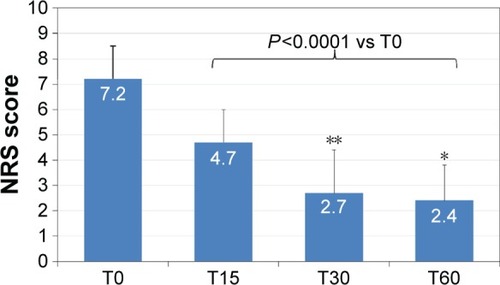
Figure 2 Waterfall image of individual changes in pain severity after 30 days of treatment with OXN-PR.
Abbreviation: OXN-PR, prolonged-release oxycodone/naloxone.
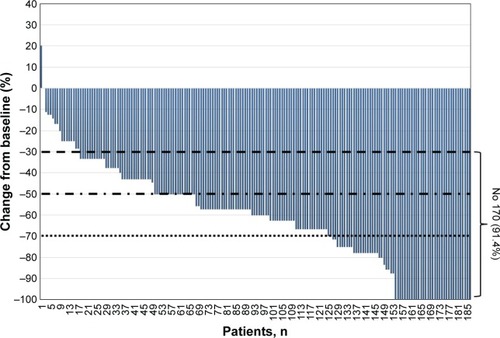
Figure 3 Changes in bowel function according to the Bowel Function Index during the 60-day treatment with OXN-PR.
Abbreviations: OXN-PR, prolonged-release oxycodone/naloxone; T0, baseline; T15, day 15; T30, day 30; T60, day.
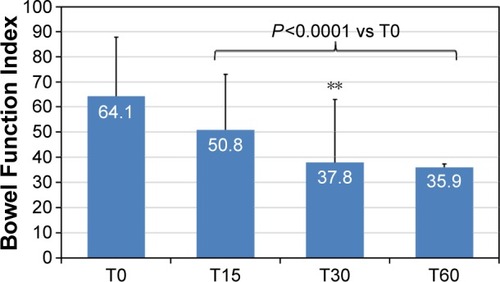
Figure 4 Changes in (A) average pain severity score measured on an 11-point NRS and (B) bowel function in the age subgroups 75–85 years (n=148) and >85 years (n=38).
Abbreviations: NRS, numerical rating scale; T0, baseline; T15, day 15; T30, day 30; T60, day 60.
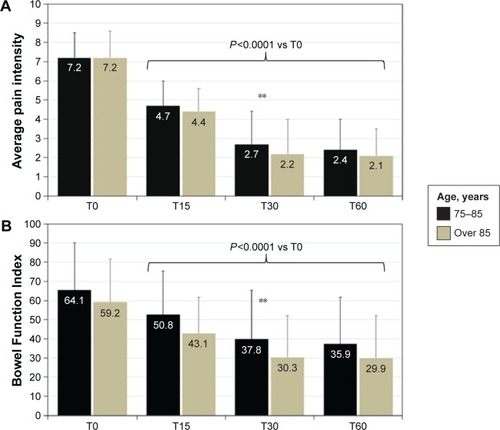
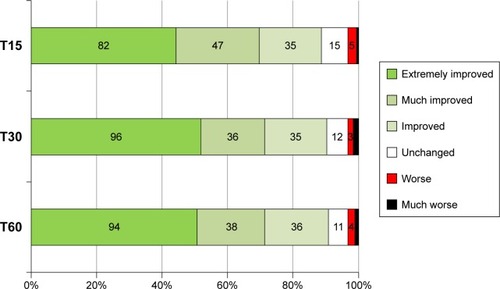
Figure 5 PGIC scale analysis after 15 days (T15), 30 days (T30), and 60 days (T60) with OXN-PR.
Abbreviations: PGIC, Patient Global Impression of Change; OXN-PR, prolonged-release oxycodone/naloxone.