Figures & data
Figure 1 Assessments of alterations in trabecular bone microarchitecture using microcomputer tomography scanning, monitoring, image reconstruction, image alignment, ROI and VOI acquisition, and three-dimensional analyses.
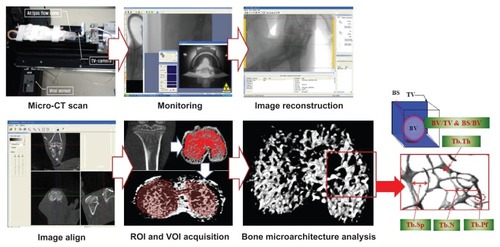
Figure 2 Relative alterations in bone microarchitectural characteristics at the tibial epiphysis after 0, 4, and 8 weeks.
Abbreviation: RA, rheumatoid arthritis.
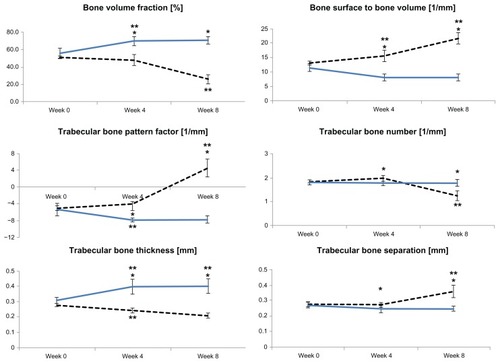
Table 1 Incidence of changes in each microarchitectural parameter in terms of the individual analysis for control and RA groups
Figure 3 Trabecular bone thickness distribution at the tibial epiphysis after (A) 0 weeks, (B) 4 weeks, and (C) 8 weeks.
Notes: Vertical axis, bone percentage, %; horizontal axis, trabecular bone thickness, mm; %; black bar, control group; white bar, RA group. *Differences between groups; **difference from 0 to 4 weeks; ***difference from 4 to 8 weeks.
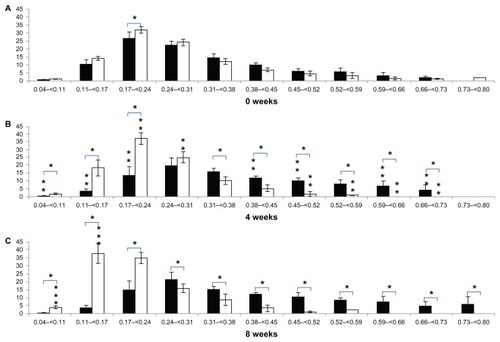
Figure 4 Alterations in trabecular bone separation distribution at the tibial epiphysis after (A) 0 weeks, (B) 4 weeks, and (C) 8 weeks.
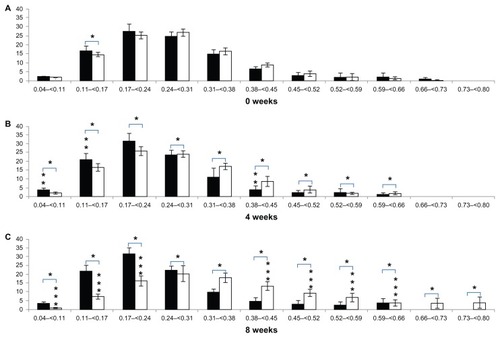
Figure 5 Representative radiologic images of the knee joints of rats in the control (upper) and RA (lower) groups at 8 weeks.
Notes: Left, anterior view; right, posterior view, showing bone erosion and osteophyte formation.
Abbreviation: RA, rheumatoid arthritis.
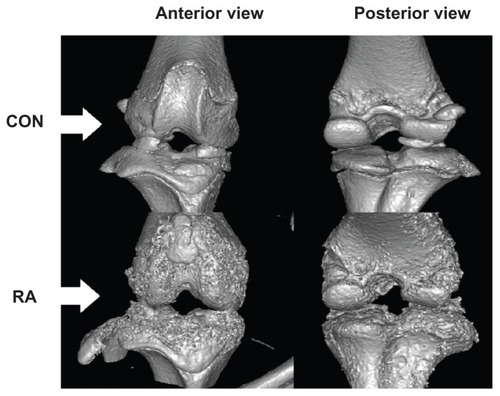
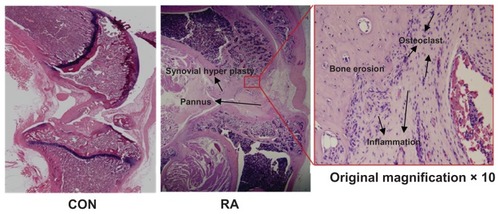
Figure 6 Representative histologic image of a knee joint with control, rheumatoid arthritis (RA) and a ×10 magnification of the section of RA (inset), showing evidence of bone erosion, inflammation, pannus formation, and synovial hypertrophy (black arrows).