Figures & data
Table 1 Incidence of Depression in Stroke Patients
Figure 1 Flow chart of the research.
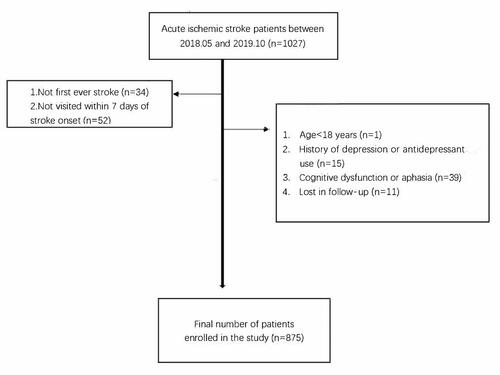
Table 2 Comparison of Baseline Characteristics Between Persistent PSD and Others
Figure 2 Nomogram predicting persistent depression in 1-year time course after stroke.
Abbreviations: FT4, free serum thyroxine level; APTT, activated partial thromboplastin time; HAMD, Hamilton Depression Scale-17 items.
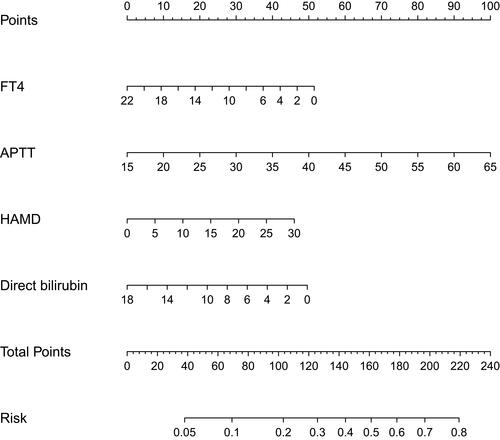
Figure 3 Calibration plots of the nomogram.
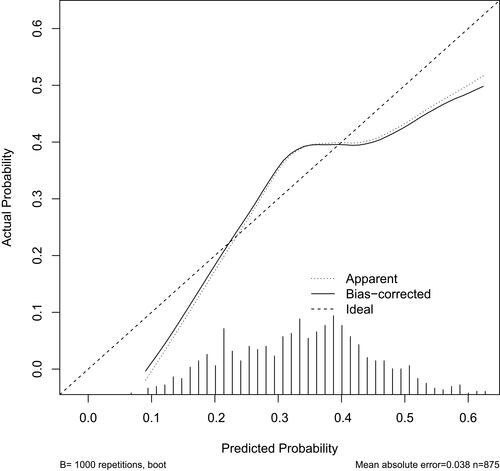
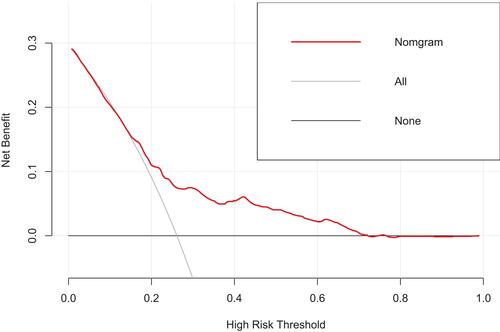
Figure 4 Decision curve analysis of the model.