Figures & data
Table 1 Change in activities of daily living (ADL) and the ADL staircase (0 to 10 steps) over the course of 6 years and association to falls at the follow-up assessment
Table 2 Proportion of fallers and characteristics of groups with risk for falls compared to reference group (staying independent in activities of daily living; n=831)
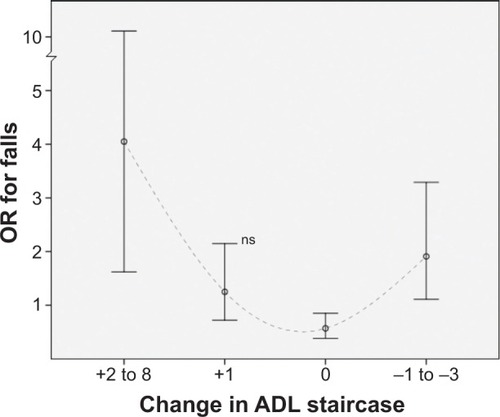
Figure 1 Change in the activities of daily living (ADL) staircase (0–10 steps) over the course of 6 years and association to falls at the follow-up assessment.
Notes: An increased score corresponds to a functional decline. Risk presented in odds ratios (ORs) with 95% confidence interval as whiskers (n=1,200).
Abbreviations: ns, not significant; n, number.
Abbreviations: ns, not significant; n, number.