Figures & data
Table 1 Population details in India, Iran, Portugal, and the UK
Table 2 Demographic details
Table 3 Percentage of categories reported in different countries
Figure 1 Percentages of associations ranked positive, neutral, and negative among participant groups.
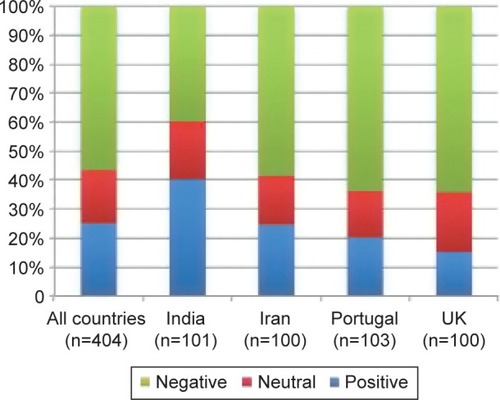
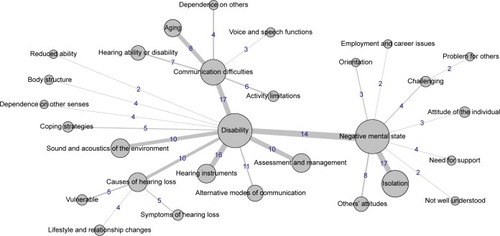
Figure 2 Co-occurrence analysis index of qualitative categories for all countries (n=404).
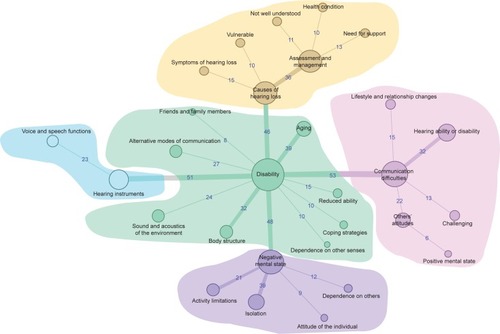
Figure 3 Co-occurrence analysis index of qualitative categories for India (n=101).
Note: The number on the line suggests the interconnection between two categories.
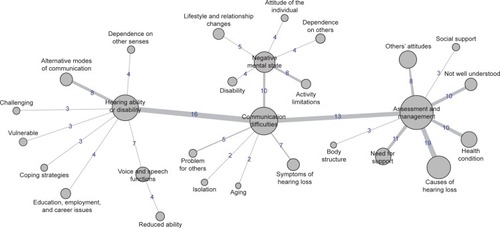
Figure 4 Co-occurrence analysis index of qualitative categories for Iran (n=100).
Note: The number on the line suggests the interconnection between two categories.
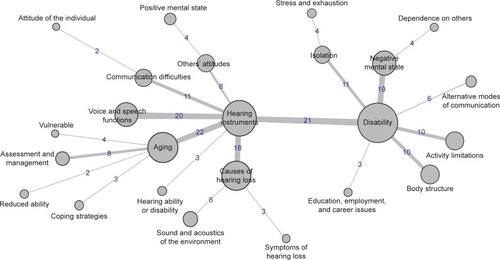
Figure 5 Co-occurrence analysis index of qualitative categories for Portugal (n=103).
Note: The number on the line suggests the interconnection between two categories.
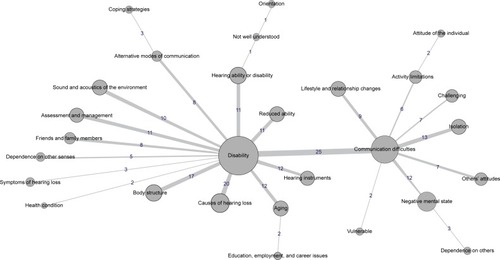
Figure 6 Co-occurrence analysis index of qualitative categories for the UK (n=100).