Figures & data
Figure 1 Overview of the relationships between ALSFRS-R, mortality and treatment.
Notes: In this diagram, treatment can have either a direct effect on mortality by γ or an indirect effect on mortality by modifying the ALSFRS-R through β and subsequently affecting mortality by α. Classically, longitudinal (e.g., linear mixed) and survival (e.g., Cox) models analyze either γ or β. Joint models incorporate all relationships and simultaneously model γ, β and α.
Abbreviation: ALSFRS-R, revised amyotrophic lateral sclerosis functional rating scale.
Abbreviation: ALSFRS-R, revised amyotrophic lateral sclerosis functional rating scale.
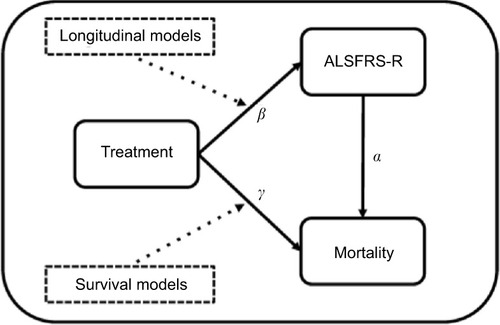
Table 1 Null and alternative hypothesis of each analytical strategy to evaluate the combined treatment effect on survival and functional loss
Figure 2 Rates of functional decline and mortality in the PRO-ACT database with a simulated treatment scenario.
Notes: (A and B) Observed rates of functional decline and death in the 1,469 selected PRO-ACT patients (). Our simulation (n = 50,000) shows a good fit with the observed dataset and exhibits a similar pattern over time. As illustration, a hypothetical treatment effect was induced, which reduced the rate of decline by 15% and the hazard by 34%. To illustrate the interaction (α) between the ALSFRS-R and survival, we divided subjects into ten equally sized groups according to their ALSFRS-R baseline score (C) or observed rate of decline during follow-up (D). Green represents the patients with the highest baseline score or the slowest rate of decline.
Abbreviations: ALSFRS-R, revised amyotrophic lateral sclerosis functional rating scale; PRO-ACT, Pooled Resource Open-Access ALS Clinical Trials.
Abbreviations: ALSFRS-R, revised amyotrophic lateral sclerosis functional rating scale; PRO-ACT, Pooled Resource Open-Access ALS Clinical Trials.
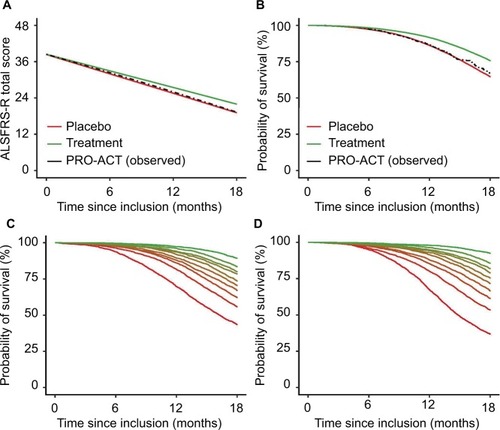
Table 2 Baseline characteristics of the PRO-ACT database’s placebo patients
Table 3 Empirical power of each strategy for trials with a maximum follow-up duration of 18 months
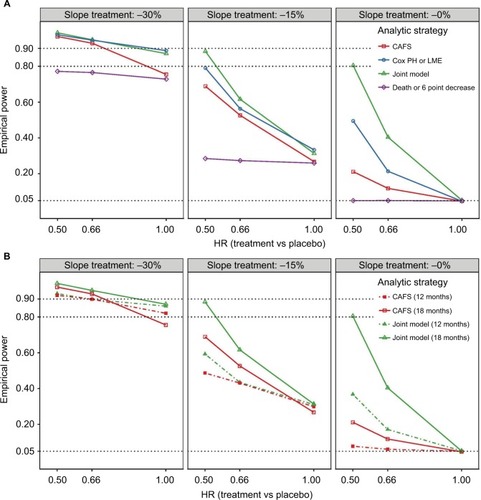
Figure 3 Empirical power of the four analytical strategies for different treatment scenarios.
Notes: (A) Visual presentation of of the empirical power after 18 months of follow-up. Panels from left to right show the effects of different treatments on functional decline (reduction in ALSFRS-R slope, β); on the x-axis are the treatment effects on survival (reduction in hazard rate, γ). (B) Direct comparison between the CAFS and the joint model for 18 months (solid lines) and 12 months (dashed lines) of follow-up.
Abbreviations: ALSFRS-R, revised amyotrophic lateral sclerosis functional rating scale; CAFS, combined assessment of function and survival; HR, hazard ratio; LME, linear mixed effects; PH, proportional hazard.
Abbreviations: ALSFRS-R, revised amyotrophic lateral sclerosis functional rating scale; CAFS, combined assessment of function and survival; HR, hazard ratio; LME, linear mixed effects; PH, proportional hazard.