Figures & data
Figure 1 The age distribution of men diagnosed with prostate cancer in the period 1998–2009 in two of the five Danish regions.
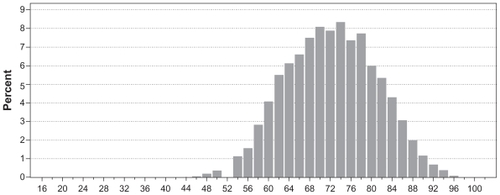
Figure 2 Overall survival in Danish prostate cancer patients diagnosed in the period 1998–2009 in two of the five Danish regions.
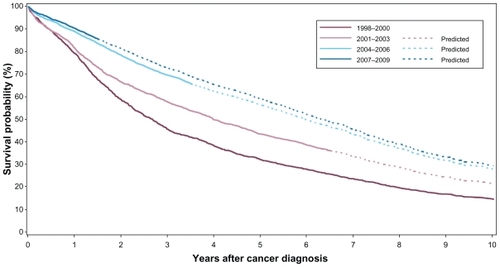
Table 1 The 1-, 3-, and 5-year overall survival and MRR adjusted for age in the four time periods
Table 2 The 1-, 3-, and 5-year survival in the four time periods according to three different age groups