Figures & data
Table 1 Examples for Candidate Effect Modifiers Identified from the Literature
Figure 1 A simulation study to illustrate the concept of confounding by indication and effect measure modification.
Notes: Presented data originate from a simulation of binary outcomes in dependence of nine covariates acting as (continuous) confounders (X), (binary) effect modifiers (Z), or both in 1500 virtual patients. The simulation framework thus addresses a typical situation of observational data from health insurance claims. The panels below show the results for each simulation scenario (A–D), where event numbers (predicted in adjusted analyses) are given within circles referring to both treatment options A (red) and B (blue) (odds ratios were derived from logistic regression models, the size of the circles is proportional to the absolute numbers of patients, whereas no statistical comparison between the groups is shown).
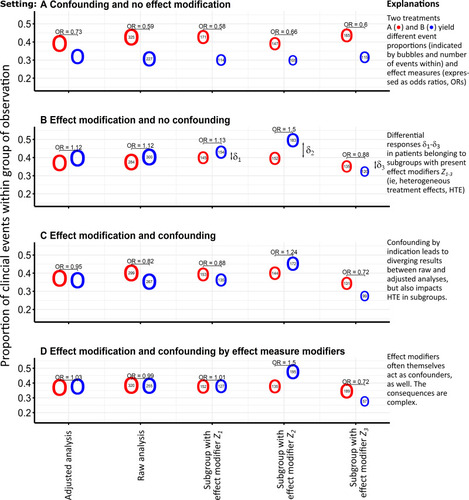
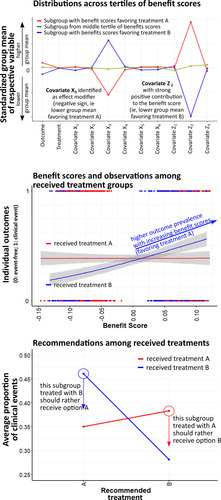
Figure 2 Prediction of individual treatment effects and recommendations from individualized treatment rules.
Notes: Conditional average treatment effect (CATE) estimation was conducted via LASSO-based penalized regression to provide the predicted individual treatment effect (PITE) expressed as benefit scores.Citation24,Citation35 A decision rule would suggest selecting treatment A if the benefit score is greater than zero. Classifying individuals according to their benefit scores will yield differing group means in the variables that are effect modifiers (top). Thus, patients under current treatment B (indicated in blue color) may also be recommended the alternative; this applies to those patients having received treatment B whose benefit scores are greater than the decision threshold set to zero (mid). This ITR therefore defines an action space where outcome frequencies above the threshold could be presumably reduced by selecting the alternative. Likewise, this also applies to the opposite case, where such a re-assignment of treatment could reduce outcome frequencies suggesting option B at benefit scores below the threshold of zero (mid, bottom).