Figures & data
Figure 1 Age-adjusted incidence rates of soft tissue sarcoma by age at diagnosis (SEER18 areas).
Abbreviation: SEER, Surveillance, Epidemiology, and End Results.
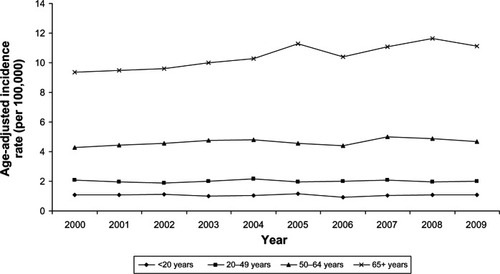
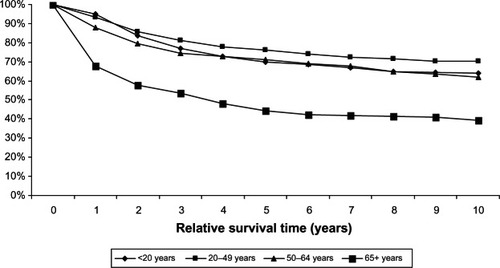
Figure 2 Relative survival of soft tissue sarcoma for different age groups, 1988–2008 (SEER 9 areas).
Abbreviation: SEER, Surveillance, Epidemiology, and End Results.
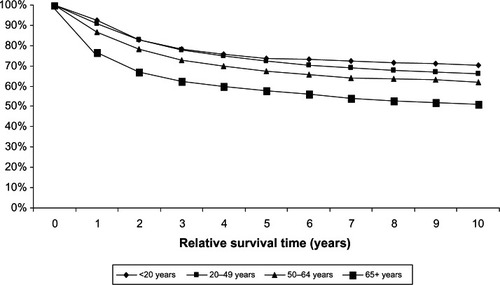
Figure 3 Age-adjusted incidence rates of bone and joint cancer for different ages at diagnosis (SEER 18 areas).
Abbreviation: SEER, Surveillance, Epidemiology, and End Results.
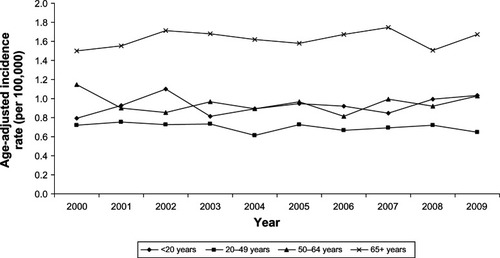
Figure 4 Relative survival of bone and joint cancer for different age groups, 1988–2008 (SEER 9 areas).
Abbreviation: SEER, Surveillance, Epidemiology, and End Results.