Figures & data
Table 1 Comparison of Age, Sex, and Underlying Comorbidities Between Patients with and without Carbon Monoxide (CO) Poisoning
Table 2 Independent Predictors for Diabetes Identified by Cox Proportional Hazards Regressions
Table 3 Comparison of the Risk for Developing Diabetes Between Patients with and without Carbon Monoxide (CO) Poisoning Using Cox Proportional Hazards Regressions
Figure 1 Comparison of the risk for diabetes between patients with and without CO poisoning using Kaplan-Meier’s method and Log rank test.
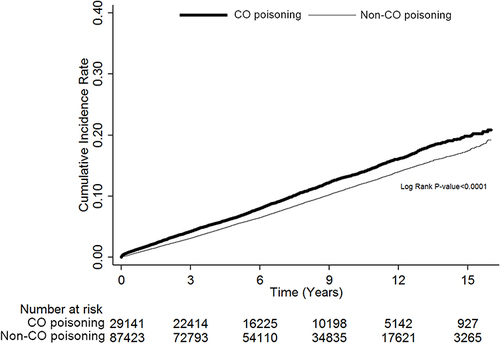
Table 4 Comparison of the Risk for Hyperglycemic Crises Between Diabetic Patients with and without Carbon Monoxide (CO) Poisoning Using Cox Proportional Hazards Regressions
Figure 2 Comparison of the risk for hyperglycemic crises between diabetic patients with and without CO poisoning using Kaplan-Meier’s method and Log rank test.
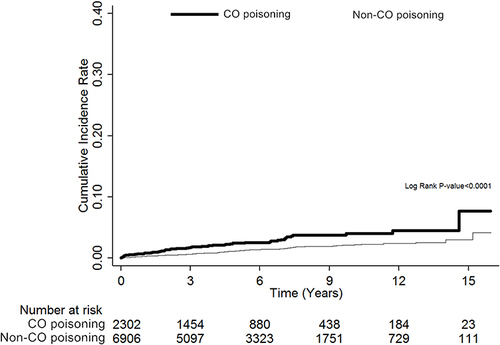
Figure 3 Pathological change in the pancreas with different magnification using hematoxylin-eosin stain and relevance of biochemical parameters manifestation. Upper row represents the sham group and the bottom row represents the CO poisoning group on CO poisoning-Day 28 (A) and statistical quantification of damage scores between two groups (B), n = 10 per group, ****p < 0.0001. Biochemical indicator like glucose (C) and relative hormone like insulin (D) and glucagon (E) were detected from the serum by ELISA assay at the indicated day, n = 10–12 per group, **p < 0.01, ***p < 0.001, ****p < 0.0001.
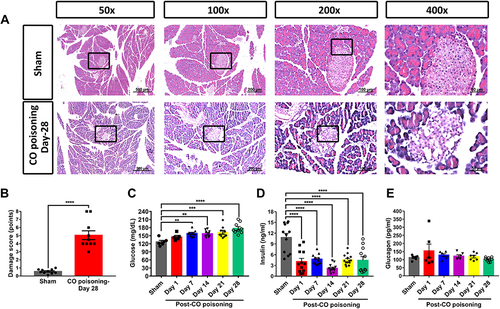
Figure 4 Insulin expression by immunofluorescence staining. Pancreatic islet was labeled by insulin antibody co-staining with nucleus staining (DAPI) shown in different magnification (200×–400×) in the sham (A) and CO poisoning group (B). Comparison of the number of insulin-positive cells per field was showed in the (C) ***p < 0.001.
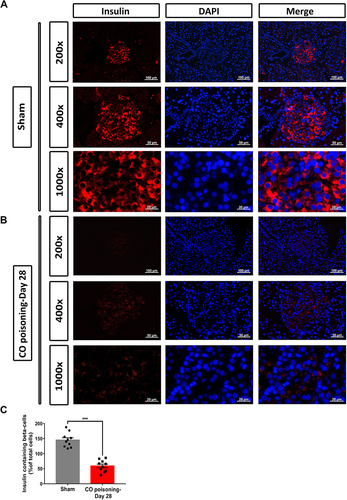
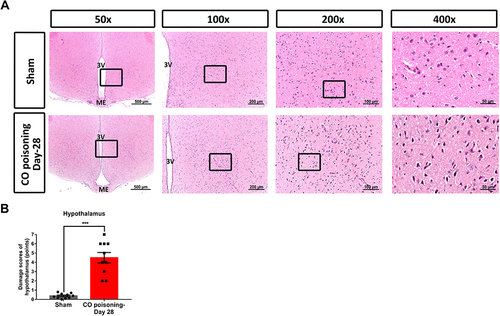
Figure 5 Histopathological change of the brain region by hematoxylin-eosin stain. Significant damages such as pyknosis, karyorrhexis, vacuolation, and immune cell infiltration were found in the hypothalamus of CO poisoning rats (A). The damage score of the hypothalamus was significantly higher in the CO poisoning-Day 28 group than that of the sham group (B). ***p < 0.001.