
Figures & data
Table 1 Clinical and Molecular Characteristics of DLBCL Patients
Figure 1 Kaplan-Meier survival curve of GCB (1) vs non-GCB (0) subtypes (log rank p = 0.08).
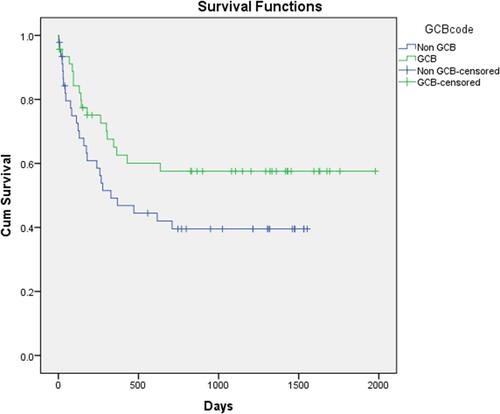
Figure 2 Kaplan-Meier survival curves of CD10 at 10% cut-off increments (A) 10% cut-off (log rank p = 0.274) (B) 20% cut-off (log rank p = 0.270) (C) 30% cut-off (log rank p = 0.127) (D) 40% cut-off (log rank p = 0.370) (E) 50% cut-off (log rank p = 0.546) (F) 60% cut-off (log rank p = 0.383) (G) 70% cut-off (log rank p = 0.273) (H) 80% cut-off (log rank p = 0.253) (I) 90% cut-off (log rank p = 0.370).
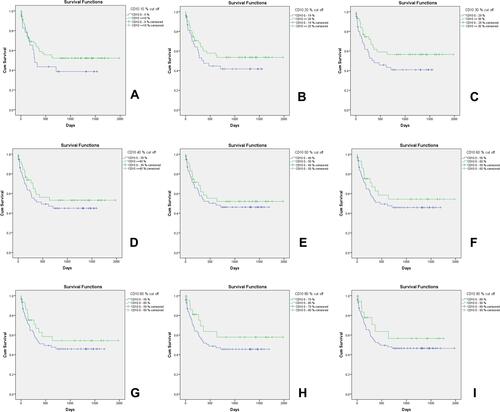
Figure 3 Kaplan-Meier survival curves of BCL6 at 10% cut-off increments (A) 10% cut-off (log rank p = 0.445) (B) 20% cut-off (log rank p = 0.195) (C) 30% cut-off (log rank p = 0.112) (D) 40% cut-off (log rank p = 0.209) (E) 50% cut-off (log rank p = 0.322) (F) 60% cut-off (log rank p = 0.333) (G) 70% cut-off (log rank p = 0.503) (H) 80% cut-off (log rank p = 0.916) (I) 90% cut-off (log rank p = 0.424).
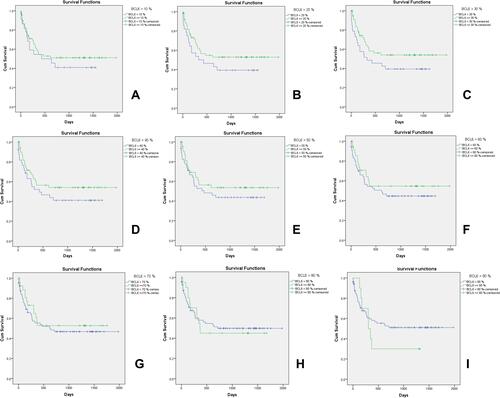
Figure 4 Kaplan-Meier survival curves of Ki67 at 10% cut-off increments (A) 10% cut-off (B) 20% cut-off (log rank p = 0.392) (C) 30% cut-off (log rank p = 0.392) (D) 40% cut-off (log rank p = 0.871) (E) 50% cut-off (log rank p = 0.582) (F) 60% cut-off (log rank p = 0.177) (G) 70% cut-off (log rank p = 0.793) (H) 80% cut-off (log rank p = 0.741) (I) 90% cut-off (log rank p = 0.976).
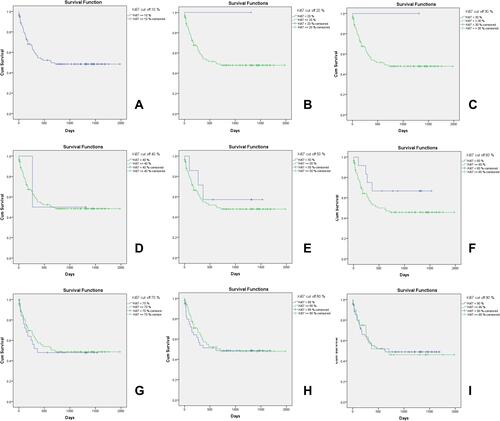
Figure 5 Kaplan-Meier survival curves of MUM1 at 10% cut-off increments (A) 10% cut-off (log rank p = 0.216) (B) 20% cut-off (log rank p = 0.618) (C) 30% cut-off (log rank p = 0.396) (D) 40% cut-off (log rank p = 0.251) (E) 50% cut-off (log rank p = 0.035) (F) 60% cut-off (log rank p = 0.003) (G) 70% cut-off (log rank p = 0.000) (H) 80% cut-off (log rank p = 0.000) (I) 90% cut-off (log rank p = 0.000).
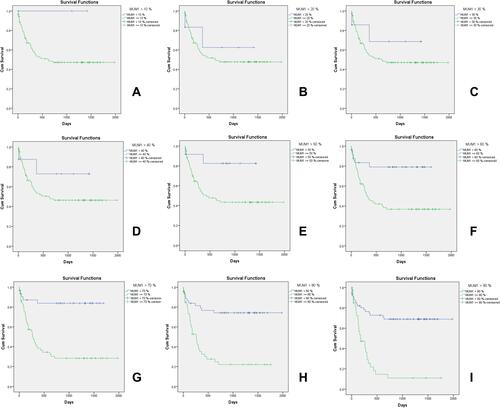
Figure 6 Kaplan-Meier survival curves of IPI (high vs low) (n = 67; log rank p = 0.04), age (old = > 60 years) (n = 92; log rank p = 0.014), and gender (n = 92; log rank p = 0.351).
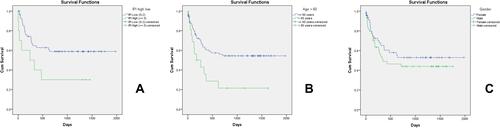
Figure 7 ROC curve from 67 patients; IPI high vs low (AUC = 0.581), age (AUC = 0.631), gender (AUC = 0.557), CD10 (AUC = 0.425), BCL 6 (AUC = 0.43), MUM1 (AUC = 0.802), Ki67 (AUC = 0.523), GCB subtype (AUC =0.431).
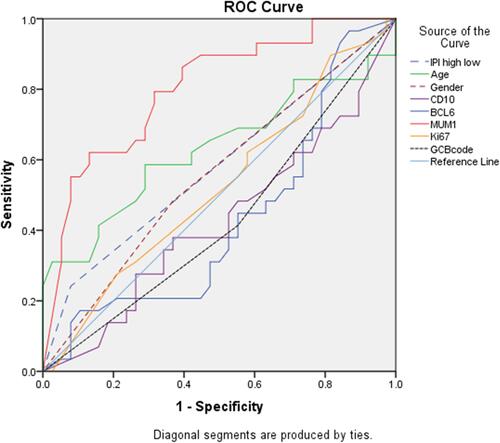
Table 2 Prognostic Value of Several Variables for Event Within 24 Months