Figures & data
Table 1 Clinical Characteristics of Patients with Oral Cavity Squamous Cell Carcinoma (OSCC) and Oral Premalignant Disease (OPMD)
Figure 1 Plasma matrix metalloproteinase-1 (MMP-1) levels from 677 specimens. (A) Significantly higher plasma MMP-1 levels in oral squamous cell carcinoma (OSCC) than oral potentially malignant disorders (OPMD). (B) Receiver operating characteristic curve for OSCC versus OPMD.
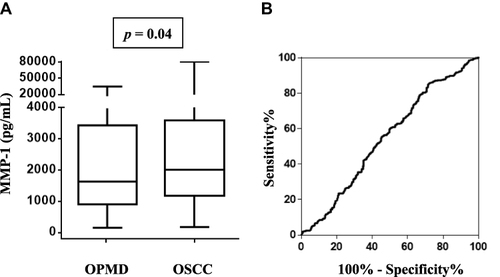
Table 2 Associations of MMP1 Protein Concentrations in Plasma with Clinicopathological Characteristics
Figure 2 Comparisons of plasma matrix metalloproteinase-1 (MMP-1) levels in oral squamous cell carcinoma patients. Associations of plasma MMP-1 levels with (A) age, (B) gender, (C) tumor depth, (D) pT, (E) pN, and (F) overall stage.
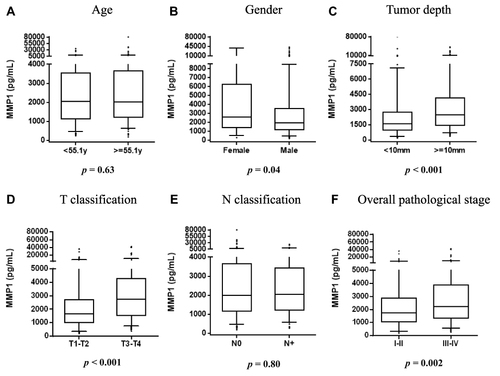
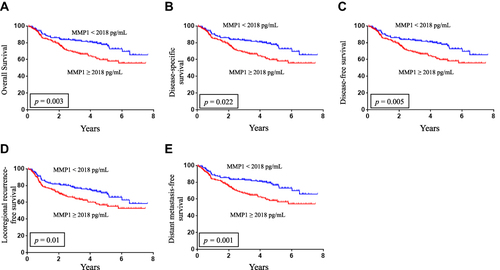
Table 3 Multivariate Analysis of Survival Analyses Stratified by the Median MMP1 Concentration (≥2018 Pg/mL Vs <2018 Pg/Ml) in 394 Patients with Oral Cavity Squamous Cell Carcinoma
Figure 3 Kaplan–Meier plot of 394 patient stratified by median value of plasma matrix metalloproteinase-1 levels (2018 pg/mL) (A) overall survival (B) disease-specific survival (C) disease-free survival (D) locoregional recurrence-free survival (E) distant metastasis-free survival.