Figures & data
Table 1 Baseline characteristics of the FAS and PAS
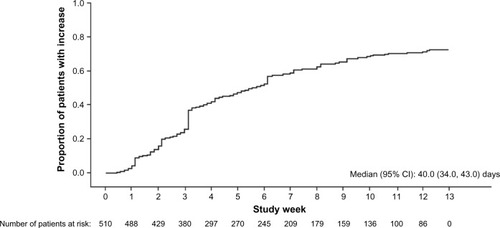
Figure 1 Mean (95% confidence intervals) change in hemoglobin levels over time in the full analysis set.
Notes: For patients with more than one hemoglobin value per study week, the mean hemoglobin value has been used. Hemoglobin measurements within 28 days after a transfusion are excluded from the analysis.
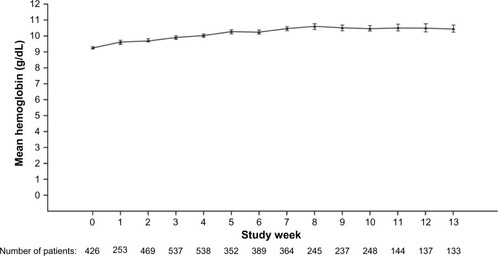
Figure 2 Time to first hemoglobin increase ≥1 g/dL in the primary analysis set.
Note: Values within 28 days of a transfusion were set to missing.
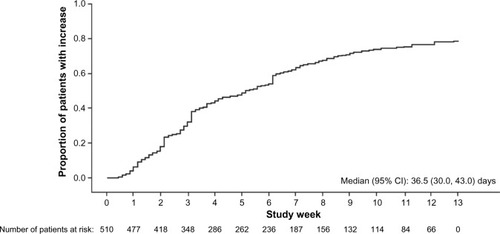
Table 2 Change in quality of life scores at week 9 (primary analysis set), as assessed by VAS and FACT-F
Figure 3 FACT-F subscale and fatigue VAS scores over time in the full analysis set.
Notes: Mean (95% confidence intervals) change in (A) FACT-F subscale scores and (B) fatigue VAS scores over time in the FAS. (A) For patients with more than one FACT-F subscale score per study week, the mean FACT-F subscale score has been used. FACT-F subscale data recorded within 28 days after an RBC transfusion were set to missing. FACT-F scores range from 0 to 52: the higher the score, the better the quality of life. (B) For patients with more than one VAS score per study week, the mean VAS score has been used. VAS data recorded within 28 days after an RBC transfusion were set to missing. VAS scores range from 0 (least fatigue) to 100 (worst fatigue).
Abbreviations: FACT-F, functional assessment of cancer therapy-fatigue; FAS, full analysis set; RBC, red blood cell; VAS, visual analog scale.
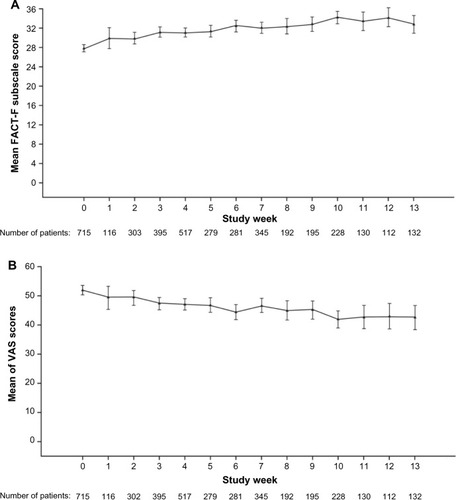
Figure 4 Time to first quality of life improvement (primary analysis set).
Note: Values within 28 days of a transfusion were set to missing.