Figures & data
Table 1 Characteristics of the patients with and without COPD
Table 2 Characteristics of patients without COPD substratified by FEV1 decline
Table 3 Characteristics of patients with COPD substratified by FEV1 decline
Figure 1 The proportion of patients who are ex-smokers.
Notes: The bar chart shows the proportion of those without COPD and those with different severity stages of COPD as defined by GOLDCitation9 who are ex-smokers.
Abbreviations: COPD, chronic obstructive pulmonary disease; GOLD, Global initiative for chronic Obstructive Lung Disease.
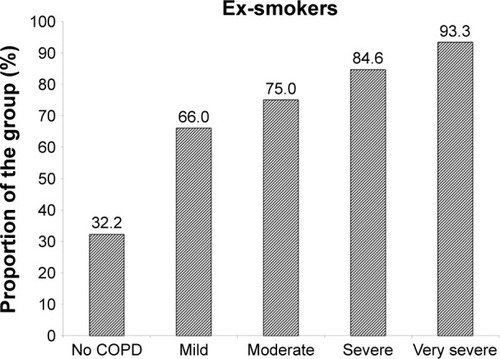
Figure 2 The proportion of subjects showing no decline or rapid decline in FEV1.
Abbreviations: COPD, chronic obstructive pulmonary disease; FEV1, forced expired volume in 1 second.
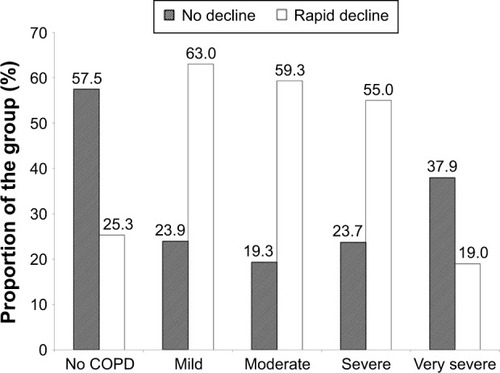
Figure 3 The relationship between the decline in FEV1 and Kco.
Abbreviations: % pred, % predicted; COPD, chronic obstructive pulmonary disease; FEV1, forced expired volume in 1 second.
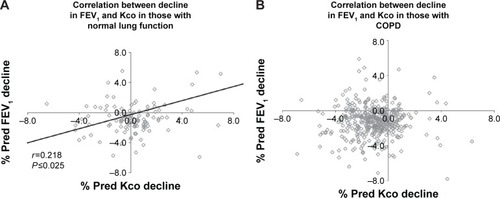
Figure 4 The decline in FEV1 for individual patients without COPD.
Notes: Representative patients have been chosen to demonstrate the pattern of FEV1 decline in (A and B) slow/no decline and (C and D) rapid decline. The similarity of the slope in patients followed over prolonged periods (B and D) to those followed over shorter periods (A and B) demonstrates that decline is linear in an individual over time, such that shorter periods might be used to determine longer-term prognosis.
Abbreviations: COPD, chronic obstructive pulmonary disease; FEV1, forced expired volume in 1 second.
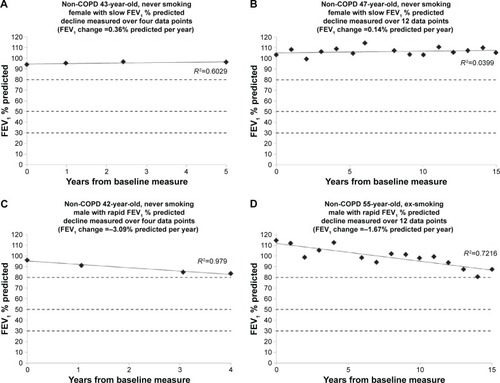
Figure 5 Decline in FEV1 for individual patients with COPD.
Abbreviations: COPD, chronic obstructive pulmonary disease; FEV1, forced expired volume in 1 second.

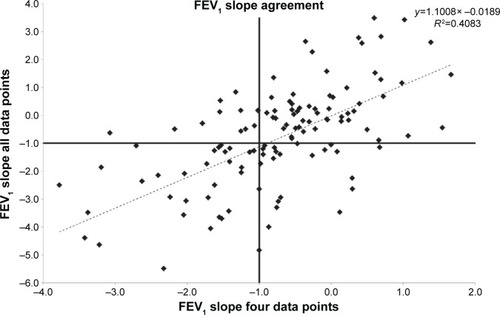
Figure 6 The degree of agreement between measures of FEV1 decline.
Abbreviation: FEV1, forced expired volume in 1 second.