Figures & data
Figure 1 Patient flow diagram.
Abbreviations: AE, adverse event; BID, twice daily; E-RS, Evaluating Respiratory Symptoms; QD, once daily.
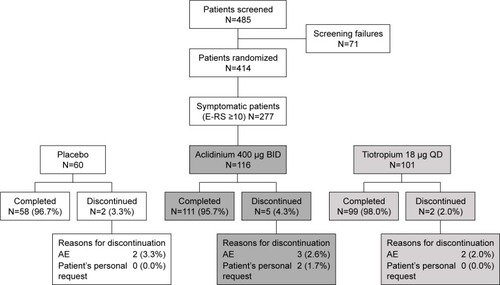
Table 1 Patient demographics in symptomatic patients (E-RS baseline score ≥10 units)
Figure 2 Symptomatic patients: mean changes from baseline in FEV1 at week 6 over 24 hours.
Notes: Placebo N=60, aclidinium 400 μg N=116, tiotropium 18 μg N=101. *P<0.05 versus tiotropium; P<0.05 for aclidinium 400 μg versus placebo and tiotropium 18 μg versus placebo at all time points, except aclidinium at 10 hours (P=0.08) and tiotropium at 23 hours (P=0.14).
Abbreviations: FEV1, forced expiratory volume in 1 second; LS, least squares.
Abbreviations: FEV1, forced expiratory volume in 1 second; LS, least squares.
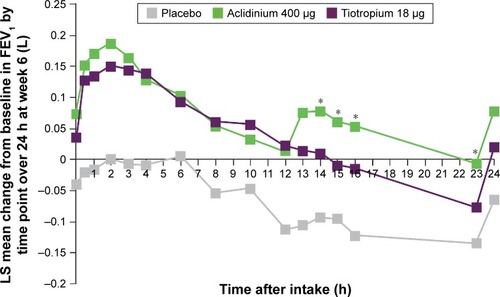
Figure 3 Symptomatic patients: change from baseline in trough FEV1 versus placebo at day 1 and week 6.
Notes: Placebo N=60, aclidinium 400 μg N=116, tiotropium 18 μg N=101. *P<0.05, ***P<0.001 versus placebo; #P<0.05 versus tiotropium.
Abbreviations: FEV1, forced expiratory volume in 1 second; LS, least squares.
Abbreviations: FEV1, forced expiratory volume in 1 second; LS, least squares.
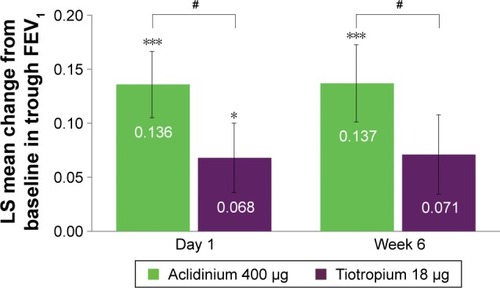
Figure 4 Symptomatic patients: change from baseline in E-RS Total and domain symptom scores versus placebo (A) and percentage of E-RS responders (B) at week 6.
Notes: Percentage reduction is shown in brackets. Placebo N=60, aclidinium 400 μg N=116, tiotropium 18 μg N=101. *P<0.05, **P<0.01, ***P<0.001 versus placebo; #P<0.05 versus tiotropium. Scores: 0–40 for Total, 0–17 for Breathlessness, 0–12 for Chest Symptoms, 0–11 for Cough and Sputum.
Abbreviations: E-RS, Evaluating Respiratory Symptoms; LS, least squares; OR, odds ratio.
Abbreviations: E-RS, Evaluating Respiratory Symptoms; LS, least squares; OR, odds ratio.
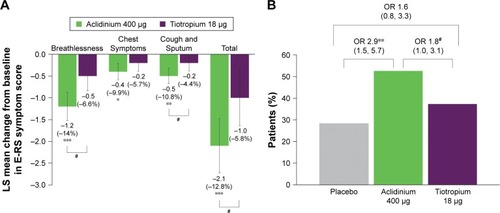
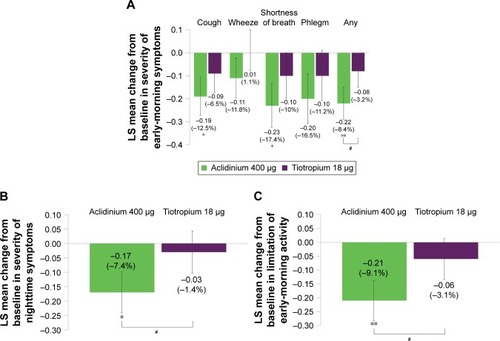
Figure 5 Symptomatic patients: change from baseline in symptom severity in the early morning (A) and nighttime (B), and limitation of early-morning activity (C) over 6 weeks.
Notes: Percentage reduction is shown in brackets. Placebo N=60, aclidinium 400 μg N=116, tiotropium 18 μg N=101. *P<0.05, **P<0.01 versus placebo; #P<0.05 versus tiotropium. Specific symptoms (A): 1= mild, 2= moderate, 3= severe, 4= very severe; any symptom: 1= no symptoms, 2= mild, 3= moderate, 4= severe, 5= very severe. For patients with no symptom, a zero value was assigned. Nighttime symptom severity (B): 1= mild, 2= moderate, 3= severe, 4= very severe. Limitation of activity (C): 1= not at all, 2= a little, 3= moderately, 4= a good deal, 5= a very good deal.
Abbreviation: LS, least squares.
Abbreviation: LS, least squares.