Figures & data
Figure 1 The influence of ADMA on the NOS and arginase pathways in COPD.
Abbreviations: ADMA, asymmetric dimethylarginine; NOS, nitric oxide synthase; L-arg, L-arginine; NOHA, N-hydroxy-L-arginine; NO, nitric oxide; ONOO−, peroxynitrite anion; PRMT, protein methyltransferase; DDAH, dimethylarginine dimethylaminohydrolase (or dimethylargininase); eNOS, endothelial NOS; iNOS, inducible NOS.
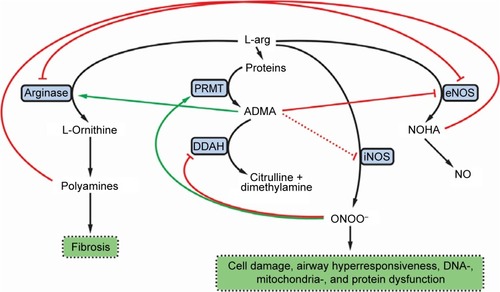
Table 1 Characteristics of the whole population of COPD patients (n=74) and of its two groups containing patients with lower (n=34) and higher (n=40) Raw values
Table 2 Main characteristics of the whole population of COPD patients (having complete SGRQ data; n=73) and of its better-controlled (n=37) and worse-controlled (n=36) groups
Figure 2 Correlation of (log transformed values of) Raw and serum concentration of ADMA in the whole data set (n=74).
Abbreviations: Raw, airway resistance; ADMA, asymmetric dimethylarginine; CI, confidence interval.
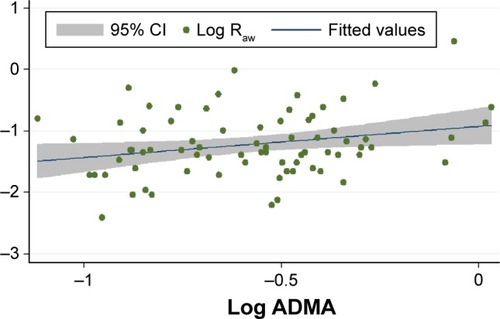
Table 3 Significant predictors of ADMA serum level and Raw determined with simple and multiple (for Raw only) linear regression for the whole population of COPD patients (n=74)
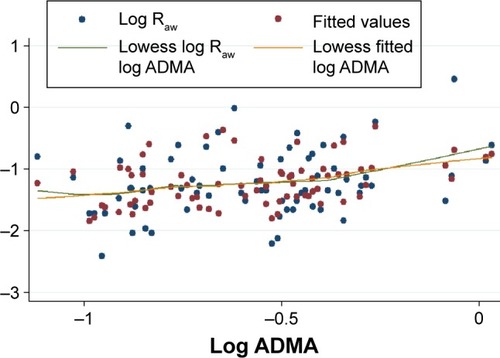
Figure 3 The model describing the correlation between (log transformed values of) Raw and serum concentration of ADMA in the whole data set (n=74).
Abbreviations: Raw, airway resistance; ADMA, asymmetric dimethylarginine.