Figures & data
Table 1 Main characteristics of the whole COPD cohort (n=74)
Table 2 Main characteristics of two groups of the COPD cohort dichotomized according to mood disturbances indicated by the Impacts score
Figure 1 Correlation of mood disturbance (characterized by the Impacts score of SGRQ) and reciprocal of serum irisin concentration in the whole data set (n=74).
Abbreviations: CI, confidence interval; SGRQ, St George’s Respiratory Questionnaire.
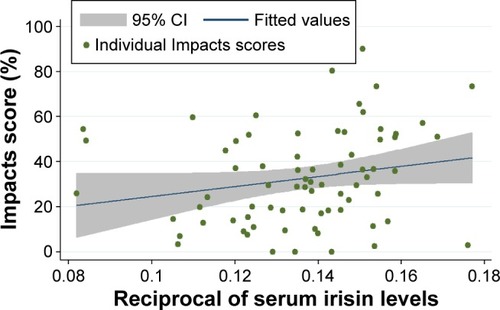
Table 3 Significant predictors of reciprocal of serum irisin level and Impacts score of SGRQ determined with simple linear regression for the whole COPD cohort (n=74)
Table 4 Multiple linear regression model for the SGRQ’s Impacts score of the whole COPD cohort and its strata with respect to the median BDNF level
Table 5 ANOVA tables describing the final model for the whole cohort (Panel A), lower BDNF stratum (Panel B), and higher BDNF stratum (Panel C)
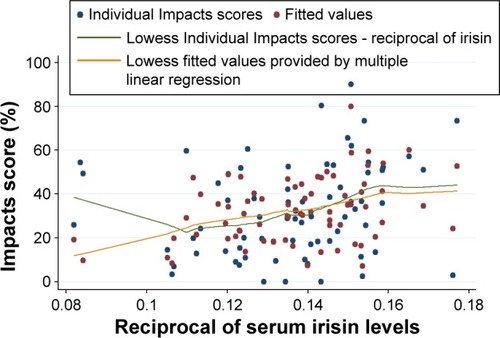
Figure 2 The model describing the correlation between the Impacts score of SGRQ and reciprocal of serum irisin concentration in the whole data set (n=74).
Abbreviation: SGRQ, St George’s Respiratory Questionnaire.