Figures & data
Table 1 Characteristics of study subjects
Figure 1 Decreased expression of MBD2 in patients with COPD.
Abbreviations: ANOVA, analysis of variance; COPD, chronic obstructive pulmonary disease; MBD2, methyl-CpG-binding domain protein 2; IgG Ab, immunoglobulin G antibody.
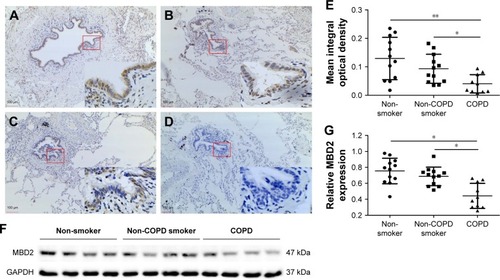
Figure 2 Lung function and histological measurements in controls and CS-exposed mice.
Notes: Compared with controls, FEV0.1s, FEV0.1s/FVC and Cdyn were significantly decreased in CS-exposed mice (A–C), but RL was elevated (D). Representative lung tissue section stained with hematoxylin–eosin of controls and CS-exposed mice (E), scale bars =100 μM; magnification = ×40. Compared with controls, MLI measurement was significantly increased in CS-exposed mice (F). Data in C and F panels are presented as mean ± SD; data of other panels are presented as median with range, n=8 for controls and n=8 for CS-exposed mice. **P<0.01 and ***P<0.001 represent significant differences compared to controls.
Abbreviations: CS, cigarette smoke; FEV0.1s, forced expiratory volume in 0.1s; FEV0.1s/FVC, ratio of FEV0.1s to forced vital capacity; Cdyn, dynamic lung compliance; RL, lung resistance; MLI, mean linear intercept.
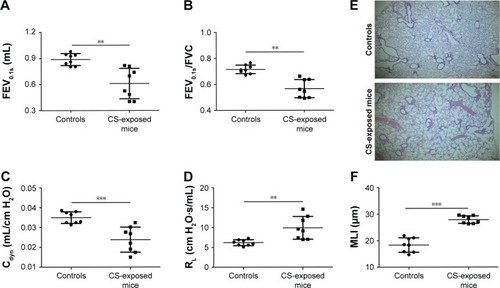
Figure 3 Downregulated MBD2 expression in CS-exposed mice.
Abbreviations: CS, cigarette smoke; MBD2, methyl-CpG-binding domain protein 2; IgG Ab, immunoglobulin G antibody.
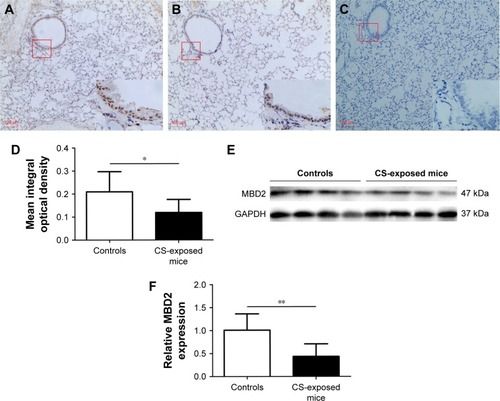
Figure 4 CSE attenuated MBD2 expression in HBE cells in vitro.
Abbreviations: ANOVA, analysis of variance; CSE, cigarette smoke extract; HBE, human bronchial epithelial; MBD2, methyl-CpG-binding domain protein 2.
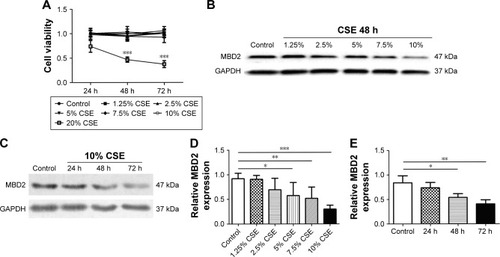
Figure 5 MBD2 knockdown increased IL-6 and IL-8 expression in HBE.
Abbreviations: Con-siRNA, negative control siRNA; HBE, human bronchial epithelial; IL, interleukin; MBD2, methyl-CpG-binding domain protein 2.
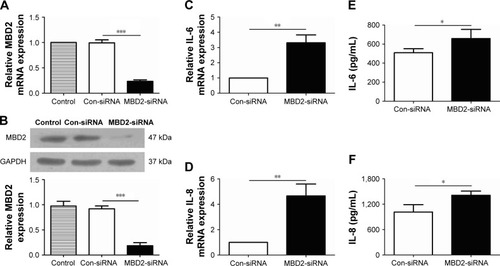
Figure 6 MBD2 knockdown enhanced ERK1/2 signal pathway-dependent IL-6 and IL-8 secretion by HBE.
Abbreviations: Con-siRNA, negative control siRNA; CSE, cigarette smoke extract; DMSO, dimethyl sulfoxide; HBE, human bronchial epithelial; IL, interleukin; MBD2, methyl-CpG-binding domain protein 2.
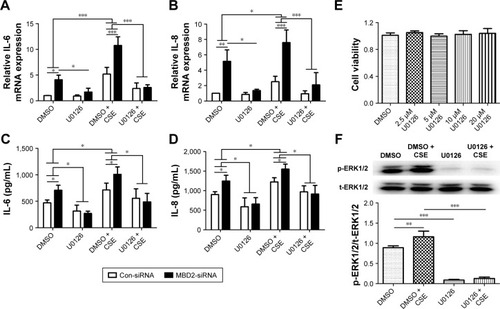
Figure S1 Representative immunohistochemical image of cells in non-smokers’ lung tissues.
Notes: The red-boxed area indicates a region of higher magnification. The arrows indicate inflammatory cells and asterisks points to alveolar mesenchymal cells.
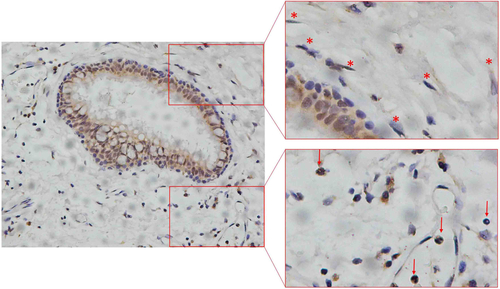
Figure S2 Levels of IL-6 and CXCL1 (KC) in BALF in controls and CS-exposed mice.
Notes: Compared with controls, levels of IL-6 (A) and CXCL1 (KC) (B) in BALF were increased in CS-exposed mice. Data are presented as means ± SD, n=8 for controls and n=8 for CS-exposed mice. P-values were calculated using Student’s t-test; **P<0.01 and ***P<0.001 represent significant differences compared to controls.
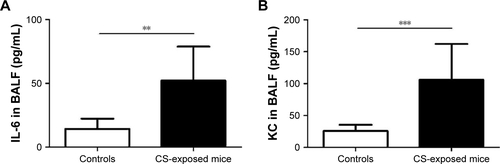
Figure S3 MBD2 protein expression in bronchial epithelium correlated with cytokines in BALF of mice.
Notes: MBD2 expression in bronchial epithelium were negatively correlated with and IL-6 (A) and CXCL1 (KC) (B) level in BALF of mice. Correlations were assessed by using Pearson analysis.
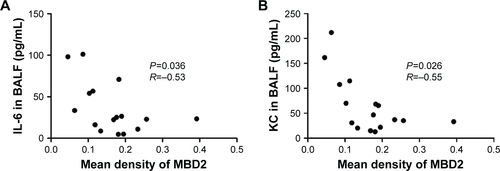
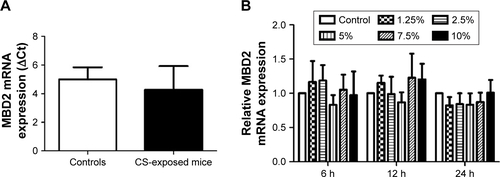
Figure S4 MBD2 mRNA in lung tissues and HBE.
Notes: No significant difference in MBD2 mRNA levels between the CS-exposed samples and controls was observed (A). There were no changes in MBD2 mRNA expression in HBE treated with different concentrations of CSE for different time periods (B).