387
Views
50
CrossRef citations to date
0
Altmetric
Original Research

Geographical distribution of COPD prevalence in Europe, estimated by an inverse distance weighting interpolation technique

, , , , , , & show all
Pages 57-67 | Published online: 21 Dec 2017

Figures & data

Table 1 Mean prevalence of COPD in 21 studies from 5 Northern Europe countries

Table 2 Mean prevalence of COPD in 11 studies from 3 Western Europe countries

Table 3 Mean prevalence of COPD in 14 studies from 5 Central Europe countries

Table 4 Mean prevalence of COPD in 15 studies from 6 Southern Europe countries

Table 5 Ages of selected samples, descriptive statistics

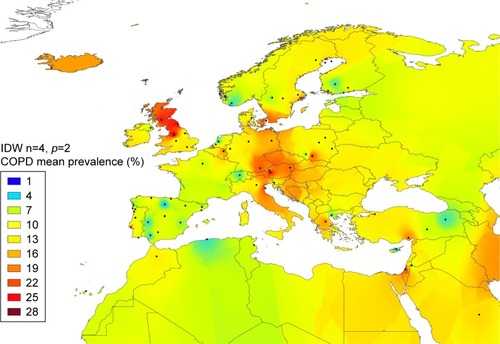
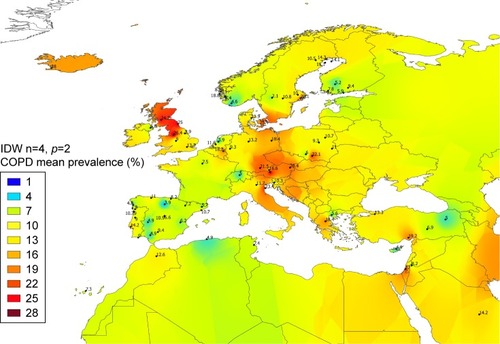
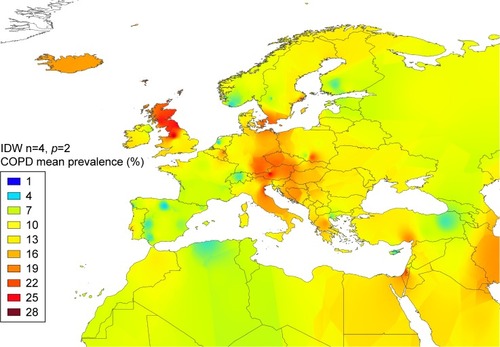
Table 6 COPD prevalence in Europe, descriptive statistics

Figure 1 COPD mean prevalence in Europe.

Notes: In this IDW interpolation map, the COPD prevalence is represented by a red–blue scale. Black spots indicate the places of origin of the data obtained from 62 selected studies. Some black spots are also shown in some nearby countries of North Africa and Middle East for guidance.
Abbreviation: IDW, inverse distance weighting.
Figure 1 COPD mean prevalence in Europe.

Figure 2 COPD mean prevalence in Europe.

Note: The IDW interpolation map shows the prevalence values of COPD at the points of origin of the patients, both in Europe and in some neighboring countries in North Africa and the Middle East.
Abbreviation: IDW, inverse distance weighting.
Figure 2 COPD mean prevalence in Europe.

Figure 3 COPD mean prevalence in Europe.

Notes: In this IDW interpolation map, spots and numerical values have been removed to allow a clearer view of the colors with which the different regions appear colored. Although there is not an exact equivalence between the qualitative data provided by the color scale and the numerical values obtained from published studies, there is an approximate correlation between them, which allows interpreting findings of the mapping with reasonable certainty.
Abbreviation: IDW, inverse distance weighting.
Figure 3 COPD mean prevalence in Europe.