Figures & data
Table 1 General characteristics of the study patients
Table 2 Characteristics of the study population by phenotype
Table 3 Cause of death according to phenotype
Table 4 Factors independently associated with mortality (Cox regression)
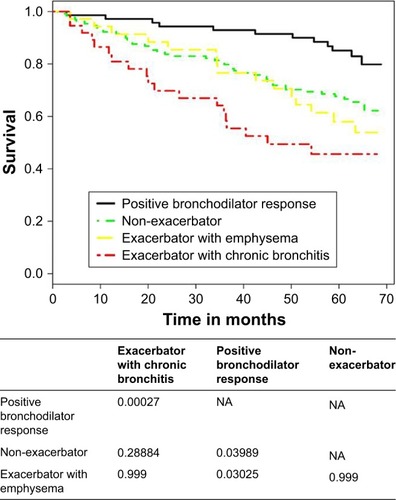
Figure 1 Kaplan–Meier survival curves according to the phenotype of COPD.
Note:
p-value for the comparison of survival curves using the log-rank test.
Abbreviation: NA, not applicable.
Abbreviation: NA, not applicable.