Figures & data
Figure 1 Schematic illustration showing that the natural history of chronic obstructive pulmonary disease is characterized by a progressive increase in gas trapping measured as a progressive increase in residual volume.
Note: A lesser increase in TLC leads to progressive decline in VC, imposing a reduction in FEV1.© 2010 European Respiratory Society. Reproduced with permission of the European Respiratory Society Eur Respir J March 2010 35:676-680; doi: 10.1183/09031936.00120609.Citation37
Abbreviations: FEV1, forced expiratory volume in one second; FRC, functional residual capacity; IC, inspiratory capacity; TLC, total lung capacity; VC, vital capacity; RV, residual volume; L, liters.
Abbreviations: FEV1, forced expiratory volume in one second; FRC, functional residual capacity; IC, inspiratory capacity; TLC, total lung capacity; VC, vital capacity; RV, residual volume; L, liters.
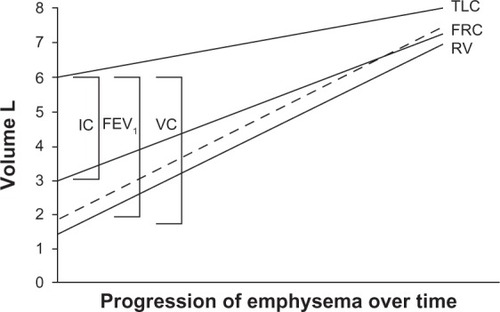
Figure 2 Effect of active treatments (differences compared with placebo) on trough FEV1 at week 26.
Notes: Data are least squares means with 95% confidence intervals. aP < 0.001 versus placebo. The broken line indicates the minimum clinically important difference.© 2012 Elsevier Limited. Reproduced with permission from Decramer et al.Citation91
Abbreviation: FEV1, forced expiratory volume in one second.
Abbreviation: FEV1, forced expiratory volume in one second.
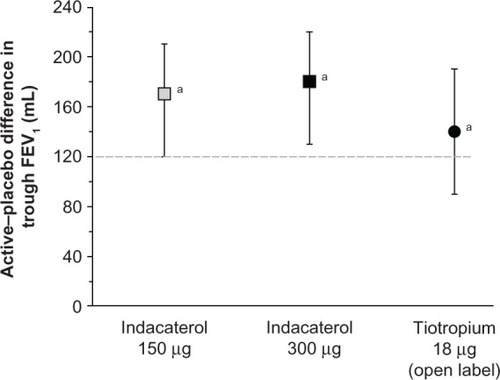
Figure 3 Range of average rate of decline of FEV1 in patients with chronic obstructive pulmonary disease according to severity of airflow obstruction.
Notes: The dashed segment of the line highlights any stage or part of it where consistent information is still lacking. Control data from the UPLIFT study were not considered in the analysis.© 2012 Dove Medical Press. Reproduced with permission from Tantucci C, Modina D. Lung function decline in COPD. Int J Chron Obstruc Pulmon Dis. 2012;7:95–99.Citation96
Abbreviation: FEV1, forced expiratory volume in one second.
Abbreviation: FEV1, forced expiratory volume in one second.
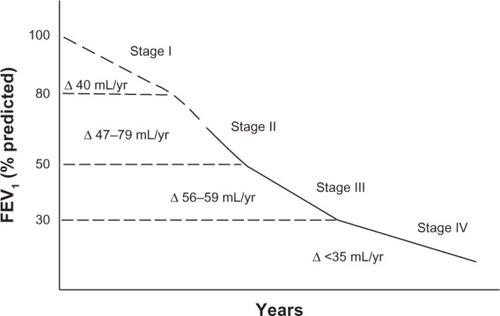
Figure 4 Comparison of effects of indacaterol and formoterol on FEV1 and inspiratory capacity as percent change in unadjusted mean values from predose.
Notes: Error bars omitted for clarity. n = 30 from each treatment. Black squares, indacaterol FEV1; black circles, indacaterol inspiratory capacity; empty squares, formoterol FEV1; empty circles, formoterol inspiratory capacity.From © 2009 Elsevier Limited. Reproduced with permission from Beier et al.Citation74
Abbreviation: FEV1, forced expiratory volume in one second.
Abbreviation: FEV1, forced expiratory volume in one second.
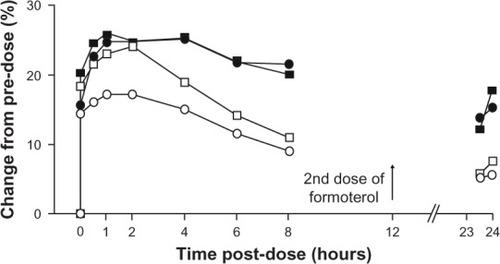
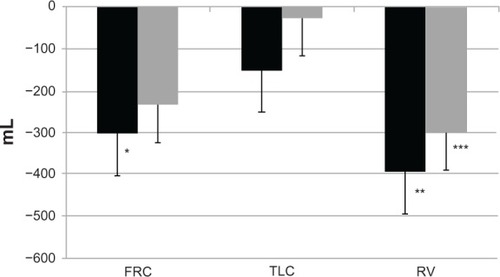
Figure 5 Changes in FRC, TLC, and RV at hour 4 after administration.
Notes: FRC was decreased compared with predose by 305+100mL with indacaterol (p=0.01*), and by 236+88 with tiotropium (p=0.053); TLC by 152+114mL with indacaterol (p=0.208), and by 28+85mL with tiotropium (p=0.806); and RV by 395+125mL with indacaterol (p=0.004**), and by 301+106mL with tiotropium (p=0.029***). Data are expressed as the mean+standard error of the mean. Black and gray bars are indacaterol and tiotropim, respectively.© 2012 Elsevier Limited. Reproduced with permission from Rossi et al.Citation105
Abbreviations: FRC, functional residual capacity; TLC, total lung capacity; RV, residual volume.
Abbreviations: FRC, functional residual capacity; TLC, total lung capacity; RV, residual volume.