Figures & data
Figure 1 Scatter plot demonstrating the relationship between sputum volume (mL) and lung function (forced expiratory volume in 1 second percentage predicted [FEV1PRED]).
![Figure 1 Scatter plot demonstrating the relationship between sputum volume (mL) and lung function (forced expiratory volume in 1 second percentage predicted [FEV1PRED]).](/cms/asset/3cee0db9-2c5f-47cf-a870-5014878a4aed/dcop_a_22896_f0001_b.jpg)
Figure 2 Boxplots representing median and interquartile range change in lung function (predicted forced expiratory volume in 1 second [FEV1] percent predicted and forced vital capacity [FVC] percent predicted) from baseline after intervention in high-frequency chest wall oscillation (phase 1) and conventional arm (phase 2).
![Figure 2 Boxplots representing median and interquartile range change in lung function (predicted forced expiratory volume in 1 second [FEV1] percent predicted and forced vital capacity [FVC] percent predicted) from baseline after intervention in high-frequency chest wall oscillation (phase 1) and conventional arm (phase 2).](/cms/asset/7742a23c-133a-42f3-b59b-6d7a462fef63/dcop_a_22896_f0002_c.jpg)
Table 1 Symptom and St George’s Respiratory Questionnaire (SGRQ)Citation21 dimension scores before and after intervention in each arm of the study
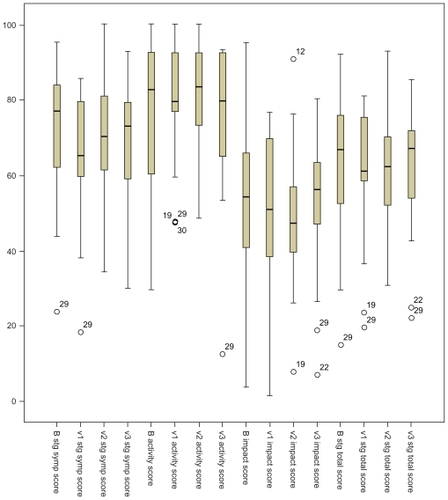
Figure 3 Boxplots demonstrating the St George’s Respiratory Questionnaire domain and total scores before and after intervention in both arms of the study (high-frequency chest wall oscillation B to v1 and conventional phase v2 to v3).