Figures & data
Table 1 E-RS™:COPD Subscales, TDI Focal Score, and SGRQ-C Total Score Responder Analyses at Week 4 (Full Analysis Set)
Figure 1 E-RS™:COPD: (A) total score; (B) breathlessness subscale; (C) cough/sputum subscale; (D) chest symptoms subscale (full analysis set). Panel 1A is reproduced from Singh D, Martinez FJ, Watz H, Bengtsson T, Maurer BT. A dose-ranging study of the inhaled dual phosphodiesterase 3 and 4 inhibitor ensifentrine in COPD. Respir Res. 2020;21(1):47. Creative commons license and disclaimer available from: (http://creativecommons.org/licenses/by/4.0/).Citation11 Data are least squares means treatment–placebo differences and 95% confidence intervals. *p<0.05; †p<0.01; ‡p<0.001 vs placebo. Least squares mean changes from baseline in the placebo group (N=79) were 0.38, 0.57, 1.11 and 1.19 at Weeks 1, 2, 3 and 4, respectively for the total score, 0.11, 0.25, 0.53 and 0.47 for the breathlessness subscale, 0.14, 0.13, 0.30 and 0.36 for the cough/sputum subscale, and 0.12, 0.18, 0.26 and 0.35 for the chest symptoms subscale. Data analyzed for 71, 74, 76, 74 and 76 patients in the ensifentrine 0.75, 1.5, 3 and 6 mg and placebo groups, respectively.
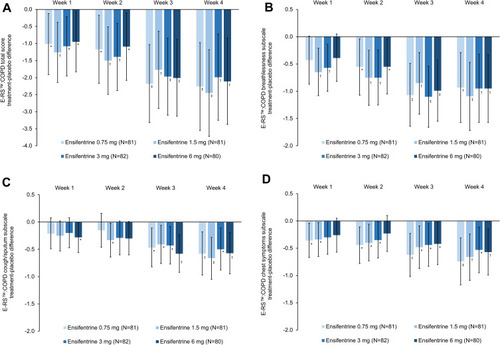
Figure 2 TDI focal score at Weeks 2 and 4 (full analysis set). Data are least squares means treatment–placebo differences and 95% confidence intervals. *p<0.05; †p<0.01; ‡p<0.001 vs placebo. Least squares mean TDI total scores in the placebo group (N=79) were 0.10 and 0.31 at Weeks 2 and 4, respectively. Data analyzed for 75, 80, 80, 78 and 76 patients in the ensifentrine 0.75, 1.5, 3 and 6 mg and placebo groups, respectively.
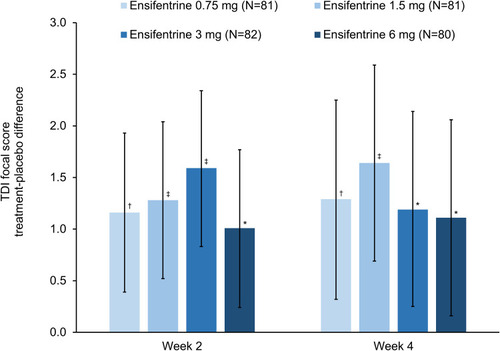
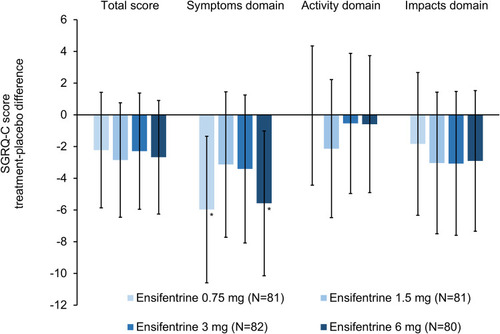
Figure 3 SGRQ-C total score and domains at Week 4 (full analysis set). Data are least squares means treatment–placebo differences and 95% confidence intervals. *p<0.05 vs placebo. Least squares mean changes from baseline in the placebo group (N=79) were –0.33, 1.25, –2.16 and 0.11 for the total score and the symptoms, activity and impacts domains, respectively. Data analyzed for 74, 75, 71, 77 and 73 patients in the ensifentrine 0.75, 1.5, 3 and 6 mg and placebo groups, respectively.