
Figures & data
Table 1 Impact of Muscarinic Receptor Antagonists on Humoral and Cellular Responses Upon Induction of a Pro-Inflammatory Stimulus in vitro. Statistically Significant Results with a P<0.05 are Reported in the Table
Table 2 Impact of Muscarinic Receptor Antagonists on Humoral Response Upon Induction of a Pro-Inflammatory Stimulus in Laboratory Animals. Statistically Significant Results with a P<0.05 are Reported in the Table
Table 3 Impact of Muscarinic Receptor Antagonists on the Inflammatory Cellular Response Induced by Different Pro-Inflammatory Stimuli in Laboratory Animals. Statistically Significant Results with a P<0.05 are Reported in the Table
Table 4 Impact of TIO 18 μg on Humoral and Cellular Inflammatory Responses Evaluated in COPD Patients. Statistically Significant Results with a P<0.05 are Reported in the Table
Figure 1 Assessment of the risk of bias via the Cochrane RoB 2 tool displayed by means of a traffic light plot of the risk of bias of each included clinical study (A), and weighted plot for the distribution of the overall risk of bias within each bias domain via the Cochrane RoB 2 tool (B) (n=6 clinical studies). Traffic light plot reports five risk of bias domains: D1, bias arising from the randomization process; D2, bias due to deviations from intended intervention; D3, bias due to missing outcome data; D4, bias in measurement of the outcome; D5, bias in selection of the reported result; Yellow circle indicates some concerns on the risk of bias and green circle represents low risk of bias.
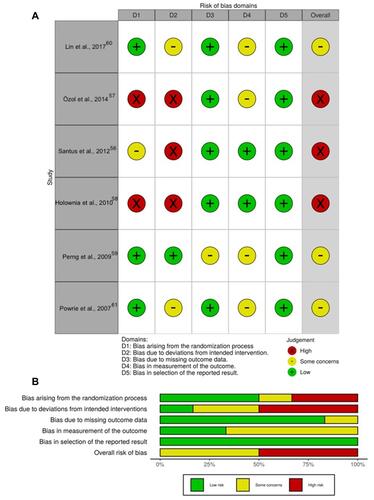
Table 5 Search Details for “Respimat” and “Asthma” in the ClinicalTrials.gov Database by Applying the Filters “with Results” and “Interventional” (Last Update July 28th 2020)