Figures & data
Table 1 Baseline Patient Demographics
Figure 1 Bland-Altman plots comparing the annualised change in FEV1% predicted (∆FEV1%predicted/year) calculated by linear regression between data collected over (A) 6 months versus 18 months (n = 72), (B) 6 months versus 3+ years (n = 27), and (C) 18 months versus 3+ years (n = 27). Data collected over 3+ years was used as the reference standard. All comparisons show that there is no agreement between any timeframe, with comparisons of 6 months versus 18 months and 6 months versus 3+ years showing proportional bias.
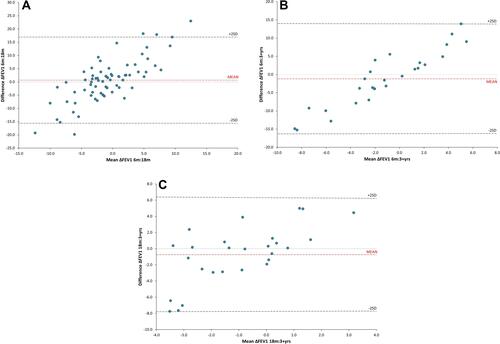
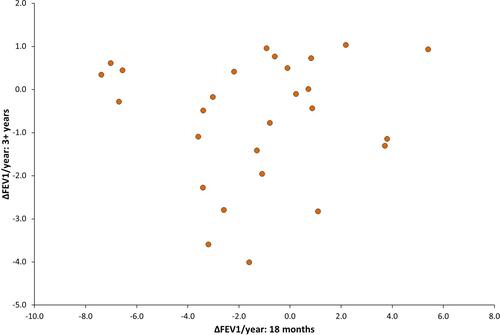
Figure 2 A scatter plot comparing the change (∆) in FEV1% predicted (calculated by linear regression) between data collected over 18 months versus data collected over 3+ years (n=27). There is no correlation between the predicted rate of FEV1 change over the two timeframes.