Figures & data
Figure 1 hADSCs suppress elastase-mediated lung histological changes in SCID-beige mice.
Notes: (A) Schematic representation of the experimental protocol. SCID-beige mice were intratracheally injected with saline or 1.25 Uelastase and then intravenously injected with PBS or 1×10⁶ hADSCs onday 3. Onday 28, lungs were collected for analyses. (B) Lung histopathological analysis by hematoxylin and eosin staining (×200). Scale bar = 50 μm. (C) Mean linear intercept of the four groups. Values are means ± SEM. (i) Control group (Saline i.t. + PBS i.v.) (n=5), (ii) hADSC group (Saline i.t. + hADSCs i.v.) (n=3), (iii) Elastase group (Elastase i.t. + PBS i.v.) (n=7), and (iv) Elastase-hADSC group (Elastase i.t. + hADSCs i.v.) (n=10). **P < 0.01.
Abbreviations: hADSCs, human adipose-derived mesenchymal stem cells; SEM, standard error of the mean; PBS, phosphate-buffered saline; i.t., intratracheally; i.v., intravenously.
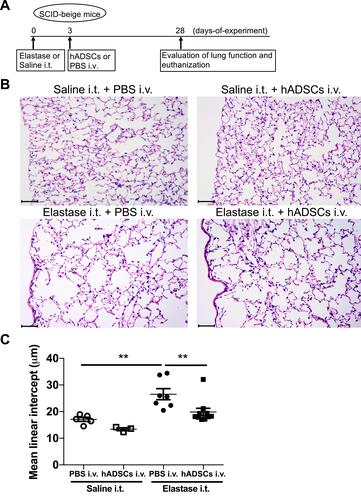
Figure 2 Lung function of emphysema mice treated with hADSCs.
Notes: The lung function FEV0.1 was measured using the flexiVent® ventilation system. Control group (Saline i.t. + PBS i.v.) (n=5), hADSC group (Saline i.t. + hADSCs i.v.) (n=3), Elastase group (Elastase i.t. + PBS i.v.) (n=7), and Elastase-hADSC group (Elastase i.t. + hADSCs i.v.) (n=10). Values are presented as means ± SEM. *P < 0.05, **P < 0.01.
Abbreviations: hADSCs, human adipose-derived mesenchymal stem cells; FEV0.1, forced expiratory volume at 0.1 s; SEM, standard error of the mean.
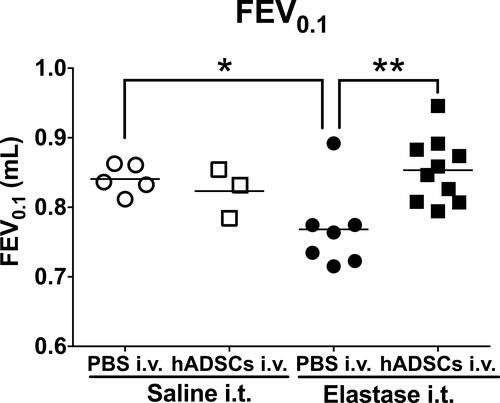
Figure 3 Gene expression of epithelial and mesenchymal genes in hADSCs isolated from lungs.
Notes: SCID-beige mice were intratracheally injected with 1.25 Uelastase and then intravenously injected with 1×10⁶ PKH26-labeled hADSCs onday 3. Onday 28, lungs were collected for analyses. (A) PKH26-labeled hADSCs were identified and sorted from the lungs of the Elastase-hADSC group (Elastase i.t. + hADSCs i.v.). (B) Gene expression changes in hADSCs isolated from the lungs of the Elastase-hADSC group (n=4) compared with naïve hADSCs (n=4) using RT2® profilerTM PCR array human epithelial-to-mesenchymal transition. Relative values to the average of naïve hADSCs are presented as means ± SEM with individual plots.
Abbreviations: hADSCs, human adipose-derived mesenchymal stem cells; SEM, standard error of the mean.
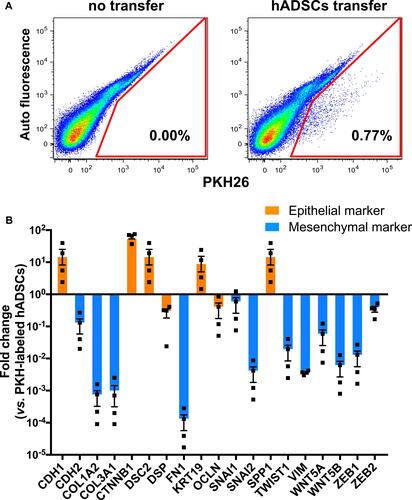
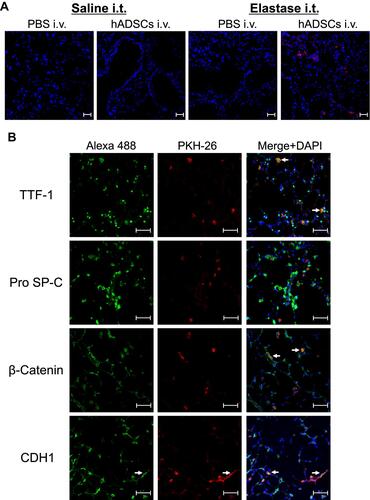
Figure 4 Fluorescence staining of epithelial markers in the lungs.
Notes: Lung sections from SCID-beige mice administered intravenously with PKH26-labeled hADSCs were observed under aconfocal laser microscope. (A) Fluorescence of PKH-26 (red) was observed with nuclear counterstaining by DAPI (blue) (×200). (B) Expression of epithelial cells markers TTF-1, Pro SP-C, β-Catenin, and CDH1 visualized by Alexa Fluor 488 (green) in PKH26-labeled hADSCs (red) (×400). Arrow shows Alexa Flour 488 and PKH-26 merged cells. Scale bar shows 50 μm. Data are representative of more than three independent experiments.
Abbreviations: hADSCs, human adipose-derived mesenchymal stem cells; DAPI, 4ʹ,6-diamidino-2-phenylindole; TTF-1, thyroid transcription factor-1; SP-C, surfactant protein C; CDH1, cadherin-1.