Figures & data
Table 1 Components of XBCQ Prescription
Figure 1 The timeline of the animal test.
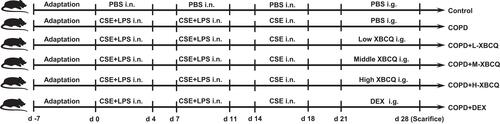
Table 2 Baseline Characteristics of Participants
Figure 2 Flow cytometry of Th17 and Treg cells in the serum of COPD patients and healthy subjects. The representative plots of Th17 cells gated by CD3+CD4+IL17+ (A). The representative plots of Treg cells gated by CD3+ CD4+CD25+ Foxp3+ (B). The level of Th17 cells (C). The level of Treg cells (D). The Th17/Treg ratio (E). Data were expressed as mean ± SEM. ***P < 0.001, **P < 0.01, compared with healthy controls.
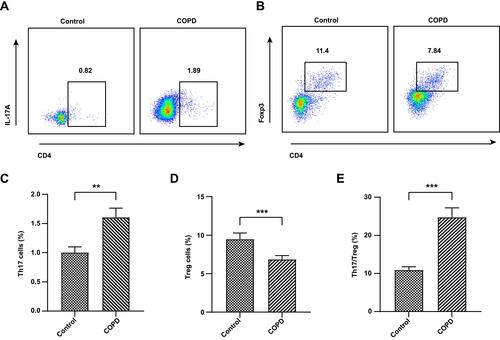
Figure 3 Major chemical compounds in XBCQ by HPLC analysis. Mixed standard substances (A). XBCQ sample, peaks 1, 2, 3, 4, 5, 6, and 7 are derived from amygdalin, rutin, isoquercitrin, aloe-emodin, rhein, emodin, and chrysophanol, respectively (B).
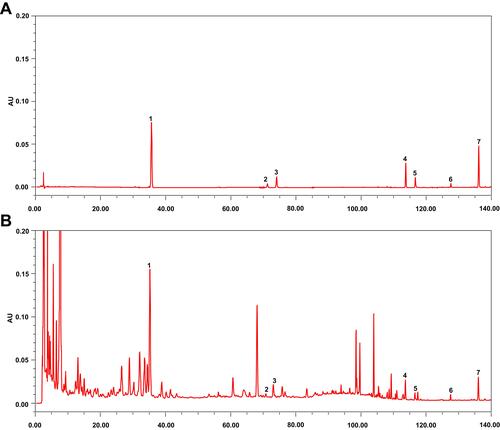
Figure 4 Effects of XBCQ treatment on body weight and lung function in CSE and LPS-induced COPD mice. Body weight changes throughout the entire duration of this study, in which mice were weighed every 5 days before administration and every 2 days after administration (A). The ratio of FEV0.2/FVC (B). Lung pathological slides by the H&E staining, where the red arrows indicate the alveolar septum rupture and the infiltration of peritracheal inflammatory cells (C). Data were expressed as mean ± SEM. ****P < 0.0001, ***P < 0.001, **P < 0.01, *P < 0.05, compared with the control group. ###P < 0.001, ##P < 0.01, #P < 0.05, compared with the COPD group.
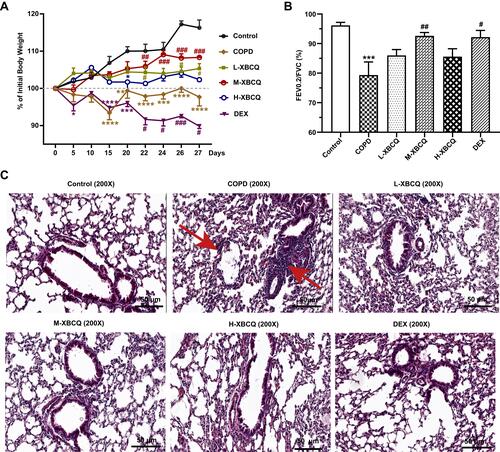
Figure 5 Effects of the middle dose of XBCQ on the lung inflammation in COPD mice. The mRNA expressions of inflammatory cytokines including TNF-α, IL-1β, and IFN-γ (A). The immunohistochemistry staining of MMP-9 in the lung tissue (B). The integrated optical density (IOD) of MMP-9 (C). Data are expressed as mean ± SEM. ****P < 0.0001, ***P < 0.001, **P < 0.01, compared with the control group. ####P < 0.0001, ###P < 0.001, #P < 0.05, compared with the COPD group.
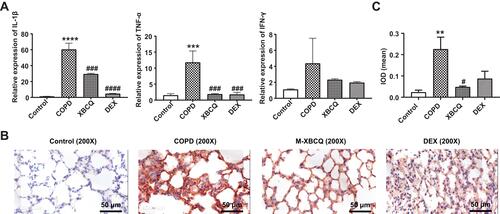
Figure 6 Flow cytometry of Th17 and Treg cells in the lung and colon of COPD mice. The representative plots of Th17 cells gated by CD3+CD4+IL17+ (A). The representative plots of Treg cells gated by CD3+CD4+CD25+Foxp3+ (B). The Th17/Treg ratio in lung and colon (C). Data are expressed as mean ± SEM. **P < 0.01, *P < 0.05, compared with control group. ##P < 0.01, #P < 0.05, compared with COPD group.
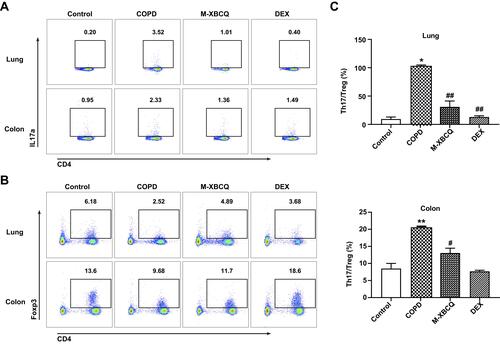
Figure 7 The alterations in the colonic microbiota structure of COPD mice. Shannon and sobs index (A). Abundant phyla (B), families (C), and genera (D) in the colonic microbiota of mice. Principal coordinate analysis (PCoA) based on Bray-Curtis and Jaccard distances (E).
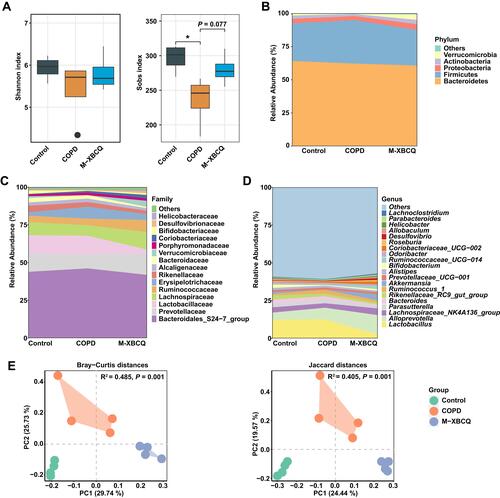
Figure 8 Differentially abundant microbes among different groups. Differentially abundant genera identified by LEfSe with a linear discriminant analysis (LDA) score (threshold ≥ 2) (A). The bubble matrix shows the average relative abundances of these genera (B).
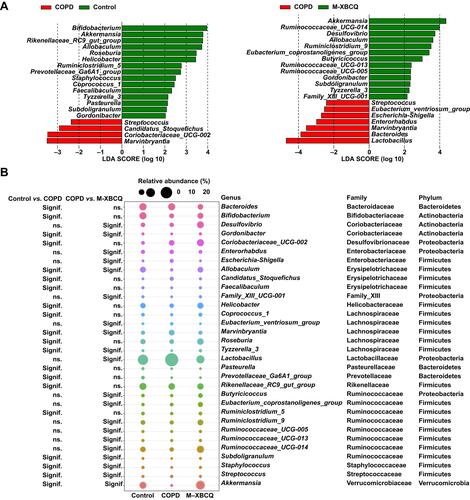
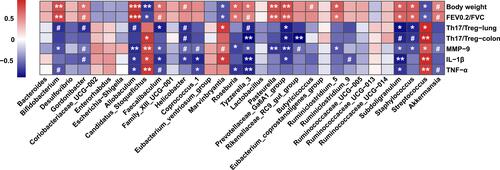
Figure 9 Spearman correlation analysis between key genera and physiological parameters affected by experimental COPD. Cells are colored based on the Spearman correlation coefficient. The red indicates a positive correlation, and the blue indicates a negative correlation. Asterisks indicate statistically significant correlations, and hash signs indicate a significant correlation trend. ***P < 0.001, **P < 0.01, *P < 0.05, #P < 0.10.