Figures & data
Figure 1 The flow chart of study screening process.
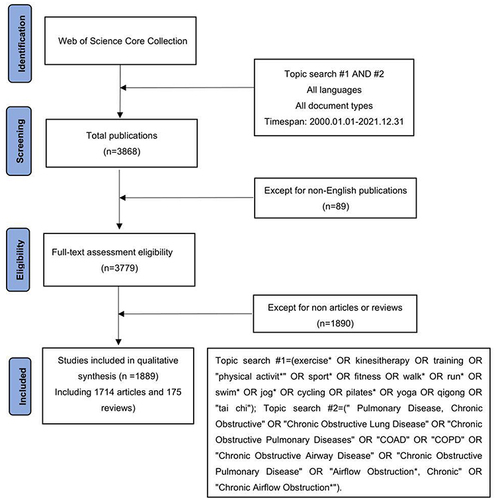
Figure 2 Number of publications and citations.
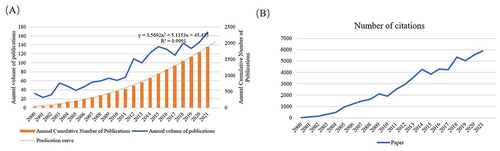
Figure 3 The item density visualization of active countries.
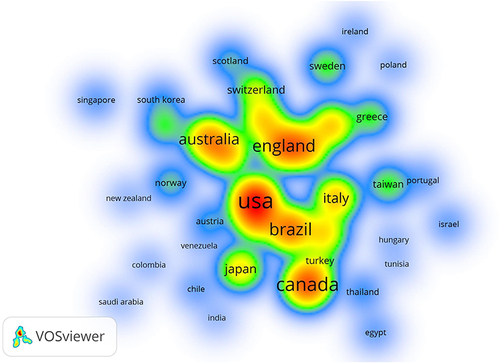
Figure 4 World Map of active countries.
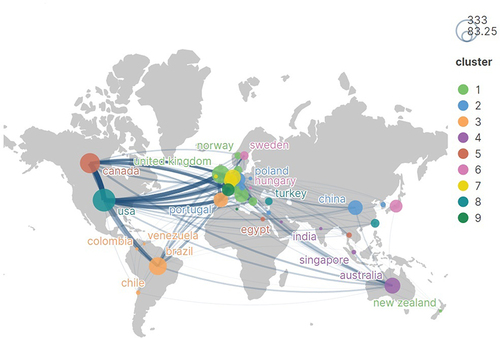
Table 1 Top 5 Active Countries with Count and Centrality
Figure 5 Map of active institutions.
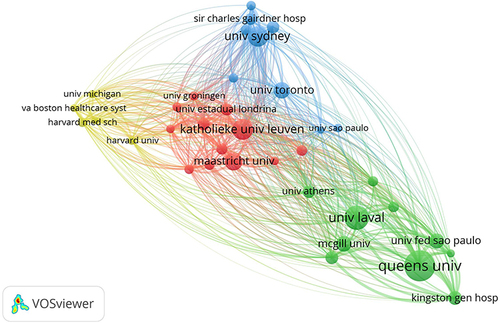
Table 2 Top 5 Active Institutions with Count and Centrality
Table 3 Top 10 Academic Journals
Table 4 Top 5 Co-Cited Journals and Centrality
Figure 6 The dual-map overlay of journals with publications.
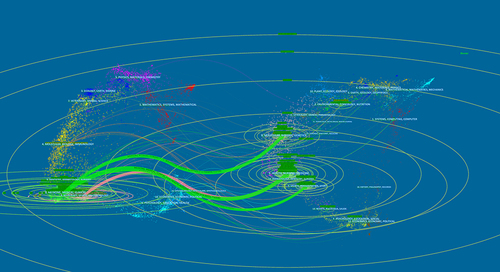
Figure 7 Map of co-cited journals with publications.
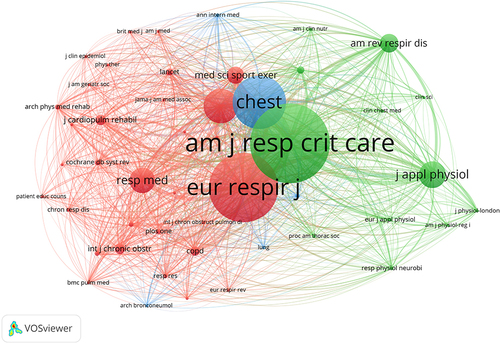
Table 5 Top 5 Active Authors and Co-Cited Authors
Figure 8 Map of authors with publications.
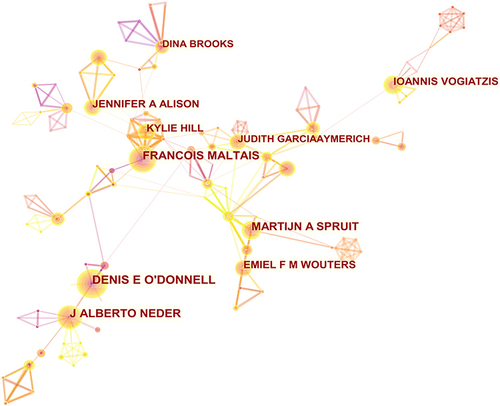
Figure 9 Map of co-cited authors with publications.
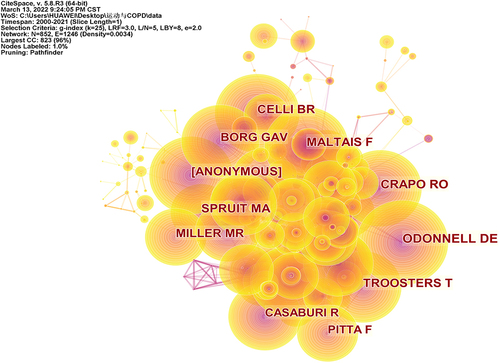
Table 6 Top 5 Co-Cited References in Terms of Counts and Centrality
Figure 10 Map of co-occurring keywords with publications.
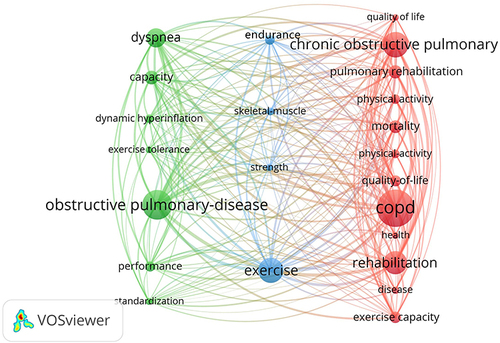
Table 7 Top 10 Keywords
Figure 11 Top 20 references co-citation with the strongest citation bursts.
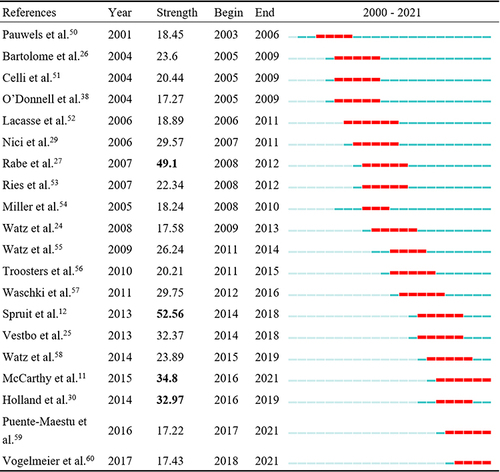
Table 8 Top-Ranked Clusters
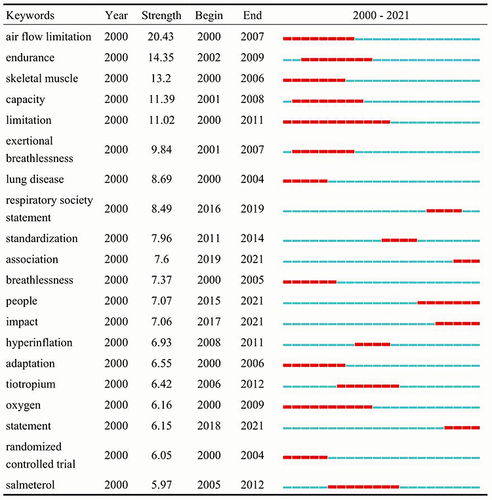
Figure 12 Top 20 Keywords with the Strongest Citation Bursts.