Figures & data
Figure 1 Study protocol. Group A: In Term1 (12 weeks), the study drug is not administered, and in Term2 (12 weeks) the study drug is administered. Group B: The study drug is administered during both Term 1 (12 weeks) and Term 2 (12 weeks). Each gray zone shows the duration of administration with the study drug.
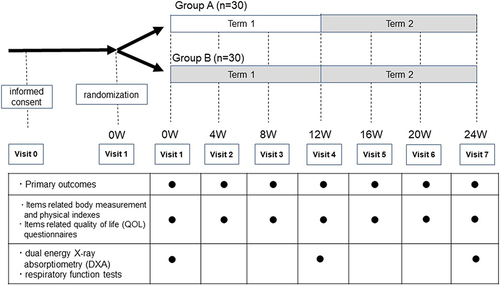
Table 1 Comparisons of Patient Characteristics Between Both Group a and B
Figure 2 Group comparison of primary endpoints by changes from Visit1 in (A) VAS fatigue scale, (B) walking speed, (C) knee extension leg strength (Right), and (D) knee extension leg strength (Left) in Groups A and B. Mean ±SD, Comparison between groups: *p<0.05 and ***p<0.001, unpaired t-test.
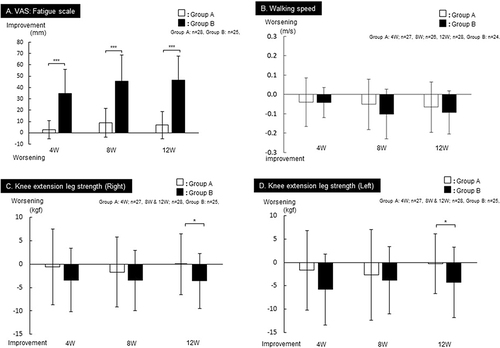
Figure 3 Group comparison by changes from Visit1 in (A) CAT, (B) mMRC, (C) SNAQ, (D) HADS anxiety scale, and (E) HADS depression scale. All values are expressed as the median. Comparison between groups: *p<0.05, **p<0.01, and ***p<0.001, Wilcoxon signed-rank tests. The numbers of participants who underwent the CAT, mMRC, SNAQ and HADS (anxiety, depression) are all 28 in Group A and 25 in Group B.

Table 2 Comparisons of Change in the Other Secondary Endpoints for 12 Weeks Between Group a and B
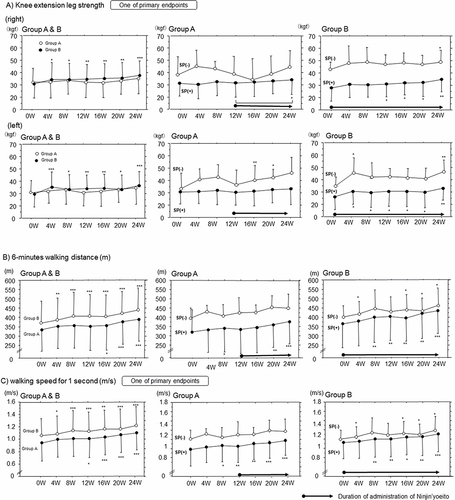
Figure 4 Time-course changes in (A) knee extension leg strength (kgf), (B) 6-minute walking distance (m) and (C) Gait speed for 1 second (m/s) in Groups A and B with or without sarcopenia (SP). Comparison with the values at 0W in each group. * p<0.05, **p<0.01 and ***p<0.001, paired Student’s t-test.