Figures & data
Figure 1 Proportion of patients reporting an exacerbation in the (A) northern or southern regions, and in (B) the tropics, averaged over 1 calendar year.
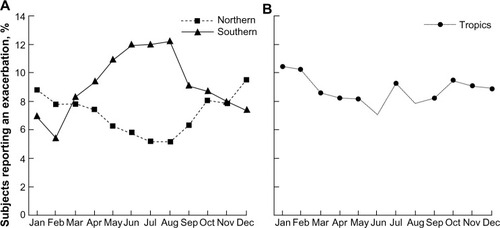
Figure 2 Diary-card data collected from the London COPD cohort between November 1995 and November 2012.
Abbreviations: COPD, chronic obstructive pulmonary disease; PEFR, peak expiratory flow rate.
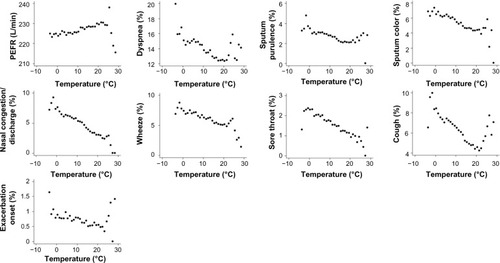
Figure 3 Seasonality of COPD mortality, by age.
Notes: Mean daily deaths per million population (mortality) for men and women aged 65–74, 75–84, and 85+ years for each month between 1976 and 2012 in England and Wales from COPD (coded with the ninth and tenth International Classification of Diseases [ICD] as ICD-9 490–492, 496 for years before 2001, and ICD-10 J40–J44 thereafter) were extracted from death-registration data supplied by the Office of National Statistics (ONS). To be compatible with deaths before 1983 and after 1993, daily deaths from COPD were divided by 0.940 to adjust for differences in mortality-coding instructions in the intervening years. Deaths classified using the ICD-10 (2001–2012) were divided by 0.966 to allow for differences between the ICD-9 and ICD-10. Deaths per day per million population were obtained after dividing daily deaths by daily population estimates obtained by fitting a fifth-order polynomial to yearly estimates of the populations from the ONS from census data.
Abbreviation: COPD, chronic obstructive pulmonary disease.
![Figure 3 Seasonality of COPD mortality, by age.Notes: Mean daily deaths per million population (mortality) for men and women aged 65–74, 75–84, and 85+ years for each month between 1976 and 2012 in England and Wales from COPD (coded with the ninth and tenth International Classification of Diseases [ICD] as ICD-9 490–492, 496 for years before 2001, and ICD-10 J40–J44 thereafter) were extracted from death-registration data supplied by the Office of National Statistics (ONS). To be compatible with deaths before 1983 and after 1993, daily deaths from COPD were divided by 0.940 to adjust for differences in mortality-coding instructions in the intervening years. Deaths classified using the ICD-10 (2001–2012) were divided by 0.966 to allow for differences between the ICD-9 and ICD-10. Deaths per day per million population were obtained after dividing daily deaths by daily population estimates obtained by fitting a fifth-order polynomial to yearly estimates of the populations from the ONS from census data.Abbreviation: COPD, chronic obstructive pulmonary disease.](/cms/asset/9e971323-6b46-4bb7-83fd-c3151a57583a/dcop_a_54475_f0003_b.jpg)
Figure 4 Time-series analysis showing the time courses of respiratory mortality following a cold day.
Abbreviation: M RES, respiratory disease mortality.
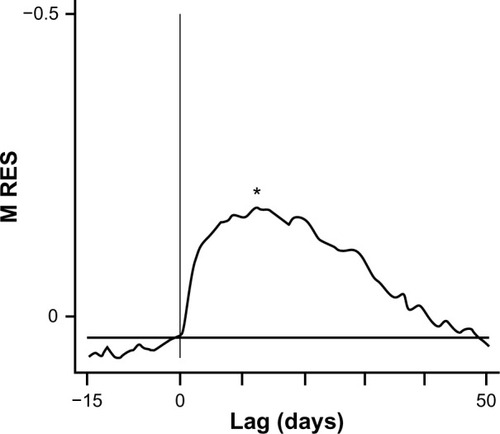
Table 1 Prevalence of respiratory viruses at COPD exacerbation
Figure 5 Weekly data on laboratory reports of respiratory virus isolation by the Health Protection Agency/Public Health England and National Health Service hospital laboratories in England and Wales.
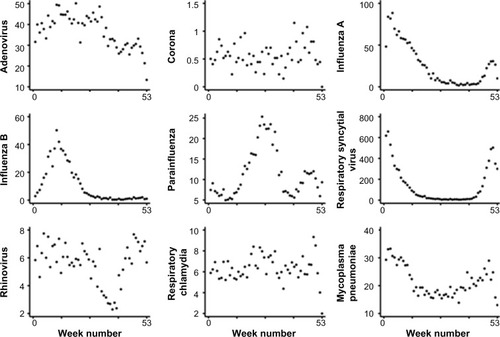
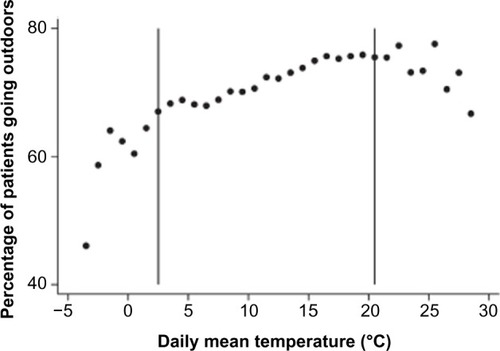
Figure 6 Percentage of patients going outside the home against the daily mean temperature throughout the year.