139
Views
18
CrossRef citations to date
0
Altmetric
Original Research

Characteristics of prevalent and new COPD cases in Greece: the GOLDEN study

, , , &
Pages 1371-1382 | Published online: 20 Jul 2015

Figures & data

Figure 1 Map of Greece showing the sampling zones from which data were collected.

Notes: Zone A, areas with very large hospitals, very high density of respiratory medicine physicians, and low ratios of expected COPD cases per physician; Zone B, areas with large respiratory medicine departments and many private practitioners; Zone C, all other areas with mostly aging rural populations and few respiratory medicine physicians.
Figure 1 Map of Greece showing the sampling zones from which data were collected.

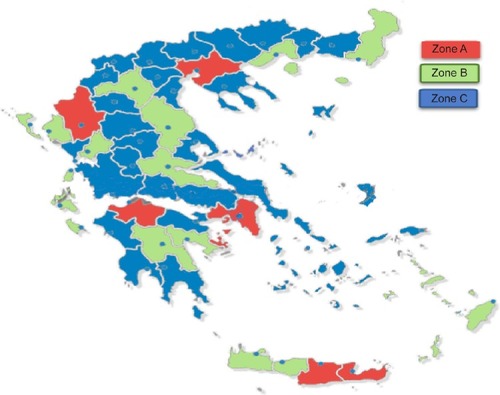
Table 1 Demographic and clinical characteristics of the prevalent cases

Table 2 Descriptive statistics of study participants according to severity of COPD (GOLD 2011)

Figure 2 Descriptive statistics of the study participants according to airflow limitation as defined by GOLD guidelines.

Abbreviations: BMI, body mass index; GOLD, Global Initiative for Chronic Obstructive Lung Disease.
Figure 2 Descriptive statistics of the study participants according to airflow limitation as defined by GOLD guidelines.

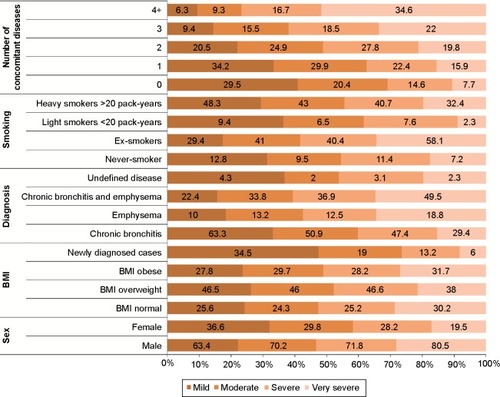
Table 3 Representativeness of COPD diagnoses per prefecture

Table 4 Characteristics of newly diagnosed patients with COPD in Greece

Figure 3 Dependence of the rate of newly diagnosed cases with COPD on prefectures (results from mixed-effect Poisson model).

Notes: All the prefectures studied were compared against Attica, wherein higher number of cases was reported. Highlighted data represent significant results. Log RR >0 indicates higher incidence, while value <0 indicates lower incidence.
Abbreviations: CI, confidence interval; COPD, chronic obstructive pulmonary disease; RR, rate ratios.
Figure 3 Dependence of the rate of newly diagnosed cases with COPD on prefectures (results from mixed-effect Poisson model).

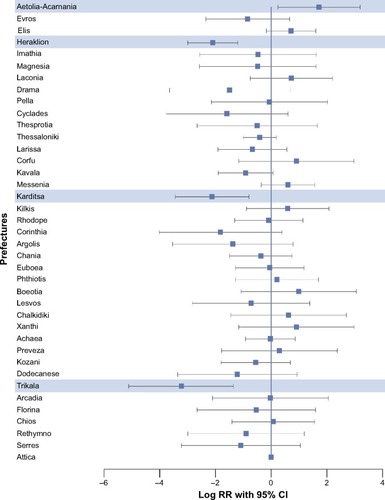
Table 5 Multivariate analysis of the rate of new diagnoses of COPD

Table S1 Dependence of the rate of newly diagnosed cases with COPD per hospital

Table S2 Dependence of the rate of newly diagnosed cases with COPD on the setting of the pulmonologist (hospital or private based)

Table S3 Dependence of the rate of newly diagnosed cases with COPD on season

Table S4 Dependence of the rate of newly diagnosed cases with COPD on the sample level