
Figures & data
Table 1 Characteristics of the 100 participants with COPD
Table 2 Correlations between IOS (R5 – R20, X5, AX, and FRes) and spirometric and plethysmographic (FEF25–75, RV, and RV/TLC) measures of small airway obstruction in 100 participants with COPD
Figure 1 Relationship between ΔFVC and ΔFEV1 in 100 participants with COPD (r=0.573, P<0.01; r= Pearson’s correlation coefficient).
Notes: Group 1: participants with R5 – R20 ≤0.030 kPa·s·L−1; Group 2 participants with R5 – R20 >0.030 kPa·s·L−1. When participants were divided according to the median value of ΔFVC of the entire population of participants (interrupted vertical line), 45 out of 80 participants of Group 2 and 5 out of 20 participants of Group 1 had a ΔFVC value higher than the median value (χ2=6.250, P=0.012). By contrast, 40 out of 80 participants of Group 2 and 10 out of 20 participants of Group 1 had a ΔFEV1 value higher than the median value of ΔFEV1 (interrupted horizontal line) (χ2=0.0, P=1.0).
Abbreviations: COPD, chronic obstructive pulmonary disease; R5 – R20, fall in resistance from 5 Hz to 20 Hz; ΔFVC, the percentage change relative to prebronchodilator value of forced vital capacity; ΔFEV1, the percentage change relative to prebronchodilator value of FEV1.
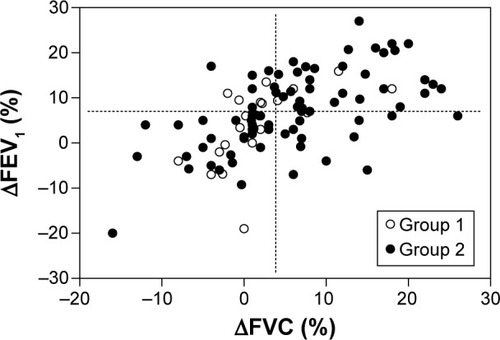
Figure 2 Relationship between ΔFVC and R5 – R20 in 100 participants with COPD.
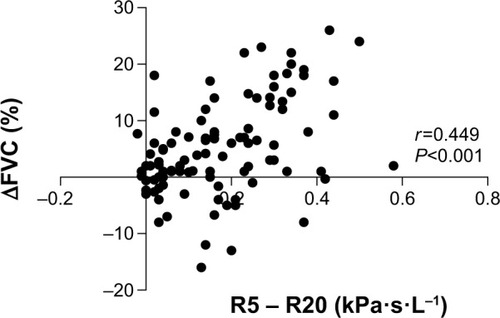
Table 3 Spirometric, plethysmographic, and IOS data of nonresponders and the three groups of responders