Figures & data
Table 1 Distribution of the studies closed in www.clinicaltrials.gov on 20 May 2010
Figure 1 Time trend in percentage of interventional studies with results among all applicable closed studies.
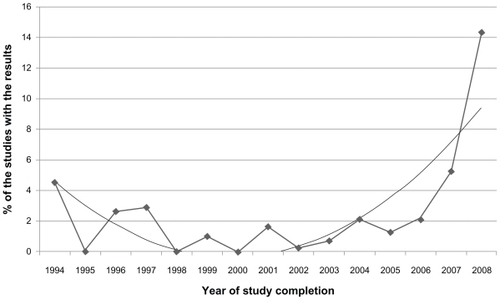
Table 2 Age and gender distribution of the interventional, active, not recruiting studies applicable to reporting the results (Phase 0–I excluded)
Table 3 Funding distribution, phases, and completion status of the interventional, active, not recruiting studies applicable to reporting of results (Phase 0–I excluded)
Table 4 Distribution of conditions of subjects in closed interventional, active, not recruiting studies applicable to reporting of results (Phase 0–I excluded)
Table 5 Sponsors of the closed interventional, active, not recruiting studies applicable to reporting of results (Phase 0–I excluded)
Table 6 Treatments that were examined in the closed interventional, active, not recruiting studies applicable to reporting of results (Phase 0–I excluded)
Table 7 Terminated interventional, active, not recruiting studies applicable to reporting of results (Phase 0–I excluded) by type of condition (shown for ≥20 total studies)
Table 8 Patient conditions in withdrawn and suspended interventions applicable to reporting of results by type of treatment (shown if ≥10 interventions). The results are not available for all studies