Figures & data
Table 1 Characteristics of MCC tablets and the various compaction conditions
Table 2 NRMSE for 10cv and external validation tests for all CI methods
Table 3 MLR model statistical parameters
Figure 1 Predicted vs observed graph for MLR.
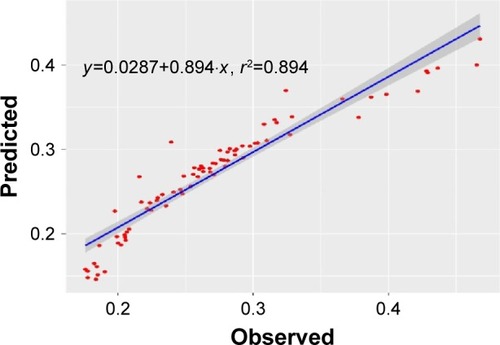
Figure 2 Predicted vs observed graph for ANN.
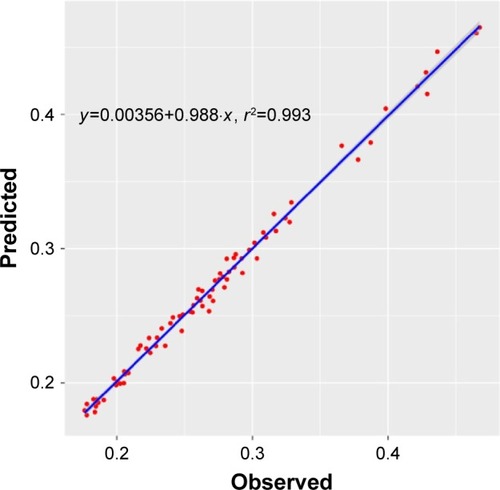
Figure 3 Predicted vs observed graph for rgp (NRMSE: 4%).
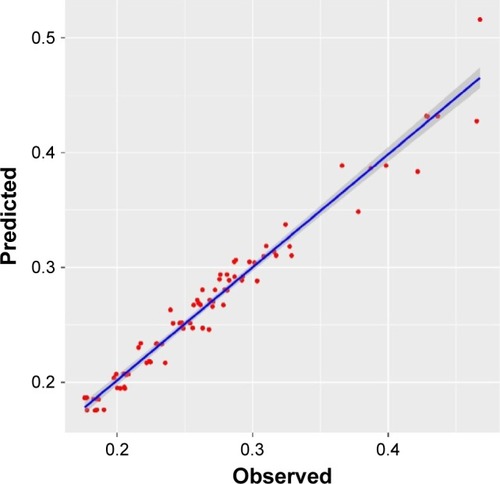
Table 4 RMSE and NRMSE for external validation data set using rgp model
Figure 4 Model performance on external data set.
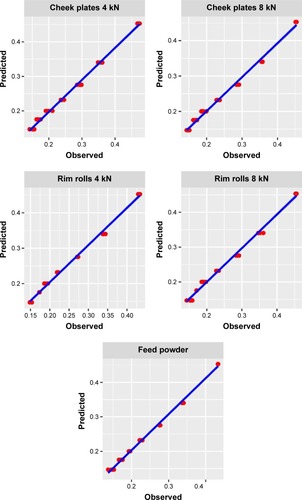
Figure 5 Surface plot showing the influence of average granule fraction size on porosity based on the monmlp model.
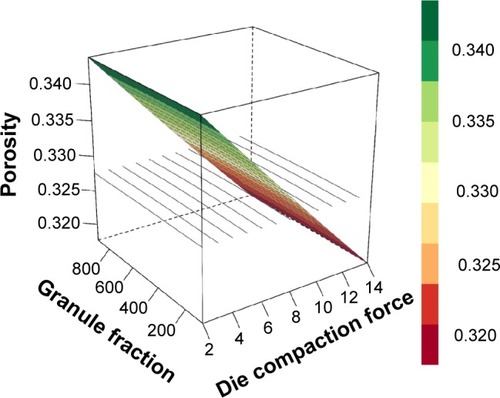
Figure 6 Surface plot showing the influence of MCC and die compaction force on porosity based on rgp model.
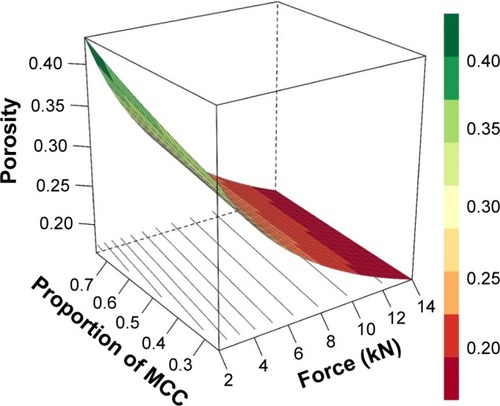
Table 5 Performance metrics for different input combinations of training and test data sets
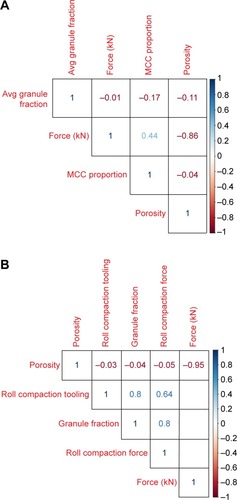
Figure 7 Correlation plots for (A) training and (B) test data.