Figures & data
Figure 1 Lipid peroxidation, antioxidant enzyme activity, and myocardial hypertrophy among the different groups.
Notes: (A) MDA content and SOD activity in myocardial tissue were determined using commercial kits. HW/BW (mg/g) was calculated by weight. (B) MSA in series was measured morphometrically at a HPF (original magnification: ×200; scale bars: 100 μm). Sham: rats underwent the same surgical procedure without banding the aorta; TAC: the ascending aorta was bended for 8 weeks; TAC plus edaravone (Edara): rats received an intraperitoneal injection of edaravone at a dose of 10 mg/kg/day for 8 weeks after TAC; TAC plus telmisartan (Telmi): telmisartan was administered via gastric gavage at a dose of 10 mg/kg/day for 8 weeks after TAC. Values are mean ± SEM (n=6/group). *p<0.05 TAC versus Sham; #p<0.05 Edara or Telmi versus TAC.
Abbreviations: MDA, malonaldehyde; SOD, superoxide dismutase; HW/BW, heart to body weight ratio; MSA, myocyte sectional area; HPF, high-powered field; TAC, transverse aortic constriction; SEM, standard error of means.
Abbreviations: MDA, malonaldehyde; SOD, superoxide dismutase; HW/BW, heart to body weight ratio; MSA, myocyte sectional area; HPF, high-powered field; TAC, transverse aortic constriction; SEM, standard error of means.
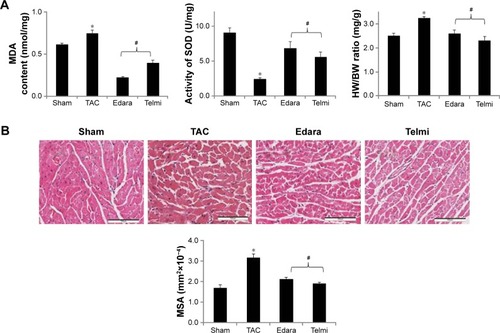
Figure 2 Expression of Ang II AT1/AT2 receptors and ACE2 in the myocardium.
Notes: (A, B) Protein level of AT1 and AT2 receptors detected by Western blot. All bands were normalized by actin as illustrated in the bar graphs. ACE2 in the intermyocardium and intracardiac vessels (insets) was determined using immunohistochemical staining (C) and calculated as MOD in the tissue section. Original magnification: ×200; scale bars: 100 μm. Values are mean ± SEM (n=6/group). *p<0.05 TAC versus Sham; #p<0.05 Edara or Telmi versus TAC.
Abbreviations: MOD, mean optical density; ACE2, angiotensin converting enzyme 2; Ang II, angiotensin II; SEM, standard error of means; TAC, transverse aortic constriction.
Abbreviations: MOD, mean optical density; ACE2, angiotensin converting enzyme 2; Ang II, angiotensin II; SEM, standard error of means; TAC, transverse aortic constriction.
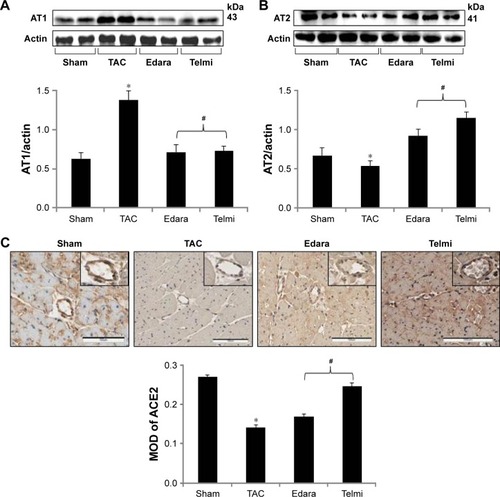
Figure 3 Macrophage accumulation, TGFβ1 protein expression, and myofibroblast proliferation among the different groups.
Notes: (A) Accumulation of macrophages and (C) proliferation of myofibroblasts were determined by the number of positively stained cells (bar graphs) using immunohistochemical staining at each HPF (magnification: ×200, scale bars: 100 μm), as indicated by the arrows. (B) Representative of TGFβ1 protein expression analyzed by Western blot. All bands were normalized by actin, respectively. Values are mean ± SEM (n=6/group). *p<0.05 TAC versus Sham; #p<0.05 Edara or Telmi versus TAC.
Abbreviations: HPF, high-powered field; TAC, transverse aortic constriction; SEM, standard error of means; TGFβ1, transforming growth factor beta 1.
Abbreviations: HPF, high-powered field; TAC, transverse aortic constriction; SEM, standard error of means; TGFβ1, transforming growth factor beta 1.
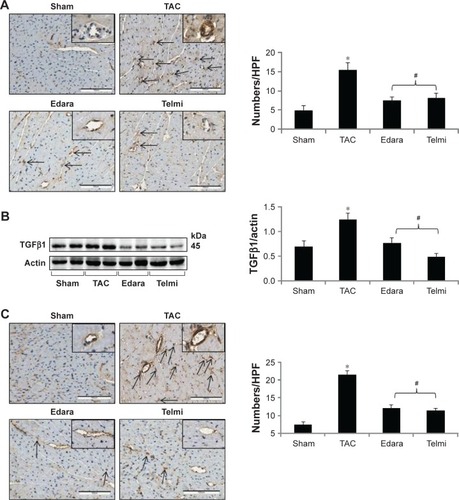
Figure 4 Protein expression levels of Smad2, Smad3, Smad4, and Smad7 among the different groups.
Notes: Protein expression levels of different Smads subtypes were analyzed using Western blot. All bands were normalized by actin among groups as illustrated in the bar graphs. Values are mean ± SEM (n=6/group). *p<0.05 TAC versus Sham; #p<0.05 Edara or Telmi versus TAC.
Abbreviations: TAC, transverse aortic constriction; SEM, standard error of means.
Abbreviations: TAC, transverse aortic constriction; SEM, standard error of means.
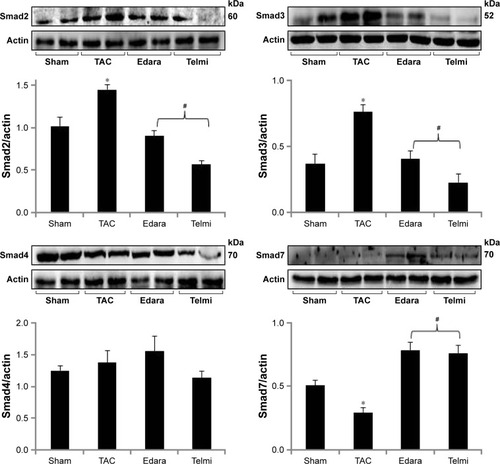
Figure 5 Detection of collagen type I, III, and fibrosis among the different groups.
Notes: (A) Deposition of collagen I in the myocardium and blood vessels (inset) was detected by immunohistochemical staining and calculated by MOD. (B) Protein expression level of collagen III was analyzed by Western blot. All bands were normalized by actin as illustrated in the bar graphs. (C) Interstitial and perivascular fibrosis in the myocardial sections was identified as blue collagen staining using Masson’s trichrome method. All images were viewed under magnification: ×200 (scale bars: 100 μm). Values are mean ± SEM (n=6/group). *p<0.05 TAC versus Sham; #p<0.05 Edara or Telmi versus TAC.
Abbreviations: MOD, mean optical density; TAC, transverse aortic constriction; SEM, standard error of means.
Abbreviations: MOD, mean optical density; TAC, transverse aortic constriction; SEM, standard error of means.
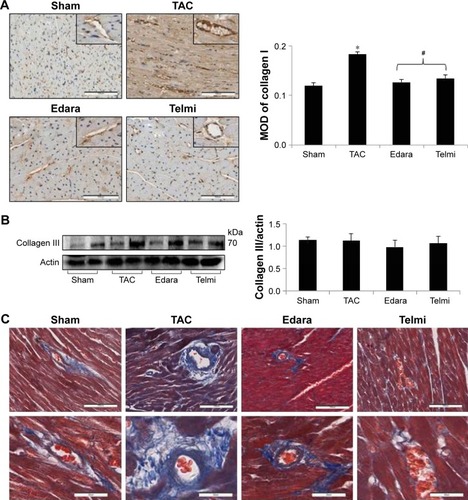
Figure 6 Heart rate and left ventricular performance.
Notes: (A) Representative recording of HR and left ventricular pressure among the different groups. Bar graphs show changes in LVSP and LVEDP (B) and changes in maximum positive (+dP/dtmax) and negative (−dP/dtmax) values of the first derivative of left ventricular pressure (C). Values are mean ± SEM (n=6/group). *p<0.05 TAC versus Sham; #p<0.05 Edara or Telmi versus TAC.
Abbreviations: LVEDP, left ventricular end-diastolic pressure; LVSP, left ventricular systolic pressure; TAC, transverse aortic constriction; SEM, standard error of means; HR, heart rate.
Abbreviations: LVEDP, left ventricular end-diastolic pressure; LVSP, left ventricular systolic pressure; TAC, transverse aortic constriction; SEM, standard error of means; HR, heart rate.
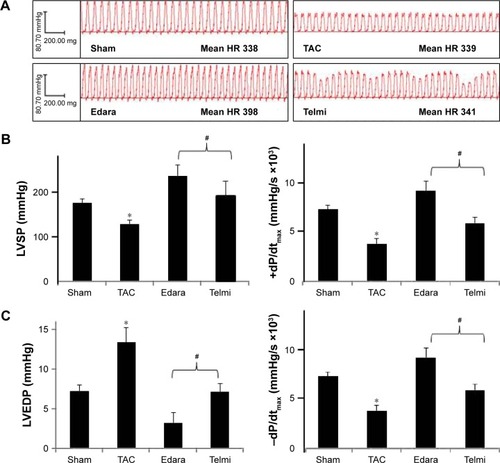
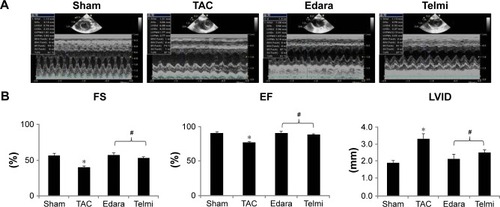
Figure 7 Echocardiographic assessment of left ventricular systolic function among the different groups.
Notes: (A) Two-dimensional echocardiographic images represent cardiac global function. (B) Cardiac systolic function was determined by measuring FS and EF. LVID was measured at end diastole. Values are mean ± SEM (n=6/group). *p<0.05 TAC versus Sham; #p<0.05 Edara or Telmi versus TAC.
Abbreviations: LVID, left ventricular internal dimension; FS, fraction shortening; EF, ejection fraction; TAC, transverse aortic constriction; SEM, standard error of means.
Abbreviations: LVID, left ventricular internal dimension; FS, fraction shortening; EF, ejection fraction; TAC, transverse aortic constriction; SEM, standard error of means.