
Figures & data
Figure 1 Mitomycin C contents after incubation at a range of pH 3–8.5. Water was the dissolved medium of the control group.
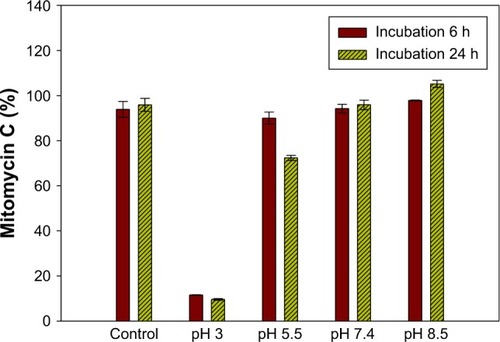
Figure 2 (A) The characterization of mitomycin C-loaded pH-sensitive liposomes by evaluation of d, PdI, ζ and its storage for a 1-month period. (B) Observational view. Mitomycin C contributed to the purple color. (C) Observation of morphology using TEM (original magnification ×25,000).
Abbreviations: d, diameter of particle; PdI, polydispersity index; ζ, zeta potential; TEM, transmission electron microscopy.
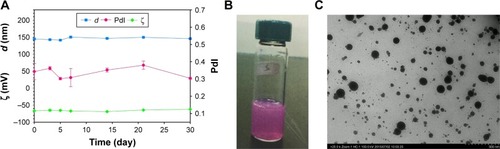
Figure 3 In vitro release behavior of mitomycin C from pH-sensitive liposomes in a physiological (pH 7.4) and a tumor acidic environment (pH 5.5).
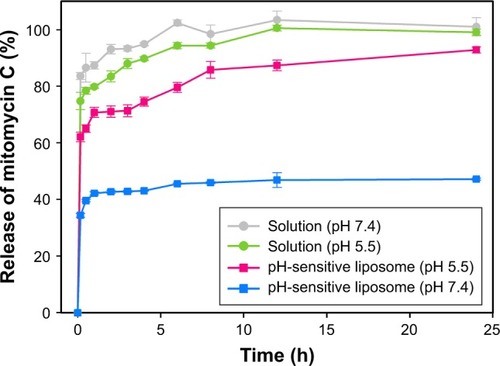
Figure 4 Cellular viability of MCF-7 cells after a 48-h treatment with different concentrations of mitomycin C solution and mitomycin C-loaded pH-sensitive liposomes. Blank indicates cells treated with pH-sensitive liposomes without mitomycin.
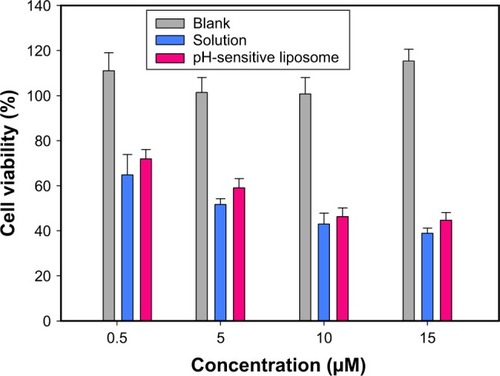
Figure 5 For flow cytometric analyses, MCF-7 cells were treated for 24 h with 0.5, 5, and 15 µM of pH-sensitive liposomes (A) with or (B) without a folate modification. (C) Fluorescence intensities were quantified as cellular uptake. Control was a cell blank without any treatment.
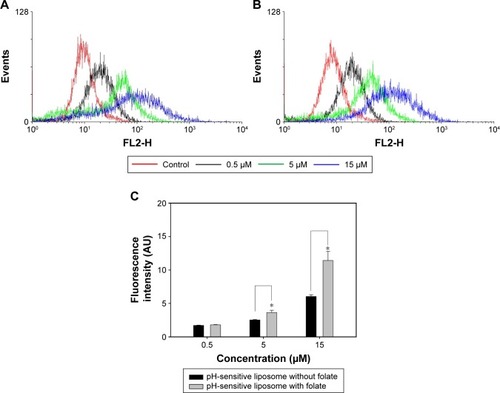
Table 1 Pharmacokinetic parameters after 8 h of intravenous administration of mitomycin C or mitomycin C-loaded pH-sensitive liposomes to rats at a dose of 5 mg/kg
Figure 6 Plasma concentration–time curves of mitomycin C in the control solution and pH-sensitive liposomes after intravenous administration of 5 mg/kg in Sprague Dawley rats.
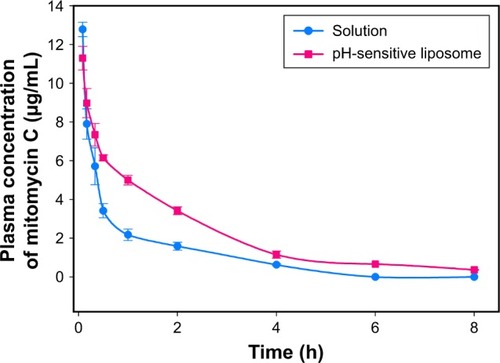
Table 2 Complete blood counts after 7 days of administration of a mitomycin C solution or mitomycin C-loaded pH-sensitive liposomes to rats at a dose of 5 mg/kg