Figures & data
Figure 1 Design and dosing schedule for (A) study 1 and (B) study 2.
Abbreviation: BID, bis in die (twice daily).
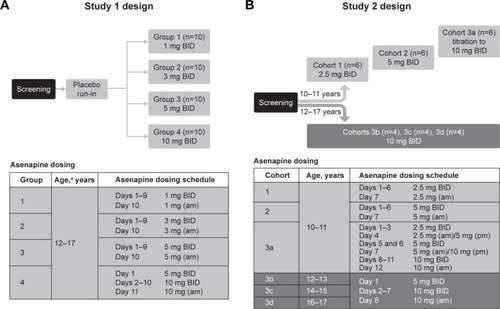
Figure 2 Mean asenapine plasma concentration–time profiles.
Abbreviation: BID, bis in die (twice daily).
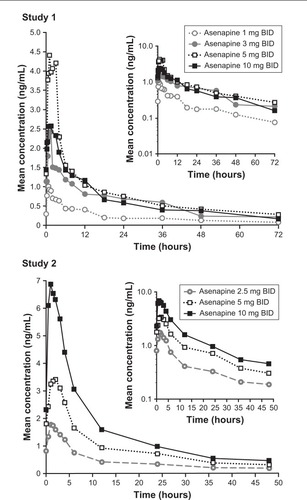
Table 1 PK parameters for asenapine following multiple BID doses by dose and age
Table 2 Treatment-emergent adverse events (TEAEs) by dose
Figure 3 Pediatric steady-state asenapine plasma concentrations (dots; studies 1 and 2) and adult model-based predictions (shaded areas) following clinically relevant doses.
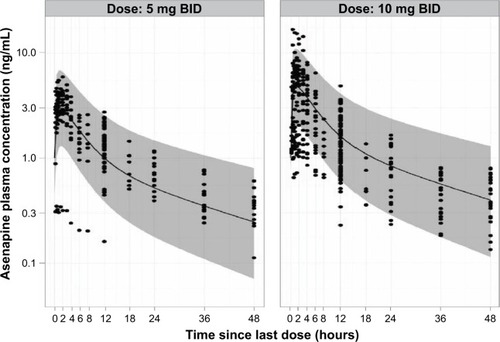
Figure 4 Goodness-of-fit plots for the final pediatric pharmacokinetic model.
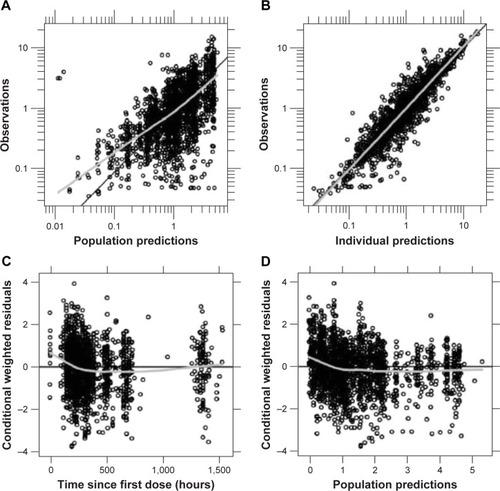
Figure 5 Visual predictive check plots for each asenapine dose.
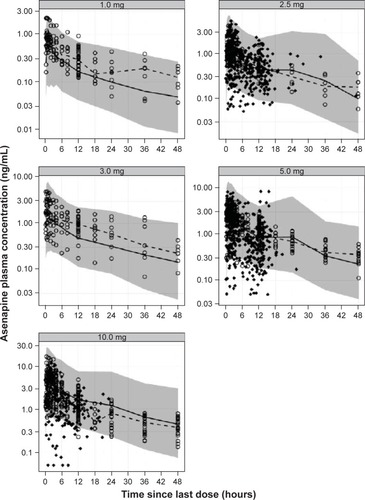
Figure 6 Impact of intrinsic factors on dose normalized AUC0–12 of asenapine.
Abbreviation: AUC0–12, area under the plasma concentration–time curve from 0 to 12 hours.
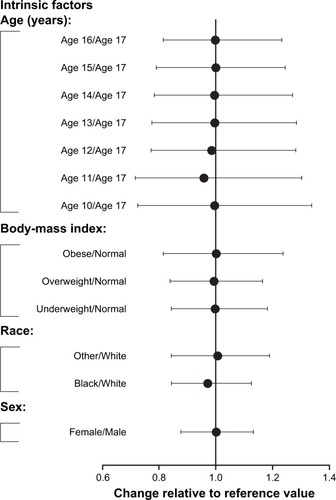
Table 3 Population PK-model parameter estimates
Table 4 Steady-state asenapine pharmacokinetics in adult and pediatric populations
Figure S1 Overview of population PK analysis of asenapine in a pediatric population. These studies consisted of 2 phase 1 PK studies (A7501022 and P06522), one phase 111 efficacy and safety study in pediatric patients aged 12 to 17 years with schizophrenia (P05896), and one phase 111 efficacy and safety study in pediatric patients aged 10 to 17 years with bipolar I disorder (P06107).
Table S1 PK Parameters for N-desmethylasenapine following multiple BID doses by dose and age
Figure S2 Exposure-response relationship of AUC0–12 and YMRS. Exposure-response relationship was examined through a visual exploration of the relationship between AUC0–12 and individual YMRS scores at endpoint in the 3-week, phase 111 study of asenapine in pediatric patients with bipolar I disorder. The boxes reflect the interquartile range (25–75th percentiles), the median denoted as solid line in each box, with the whiskers extending to the 5th–95th percentiles, and individual data outside these percentiles presented as symbols. For each bin, n is approximately 40.