
Figures & data
Table 1 Levels of dependent and independent variables used in factorial design
Table 2 Composition of NF-loaded niosomes and the measured responses (means±SD, n=3)
Figure 1 Transmission electron photomicrographs of NF-loaded niosomes.
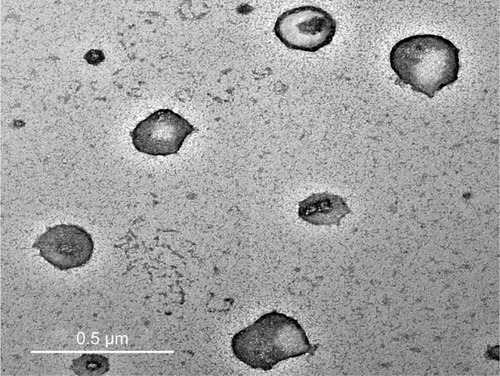
Figure 2 Release profiles of NF from NF-loaded niosomes along with NF powder: (A) N1–N8 and (B) N9–N16.
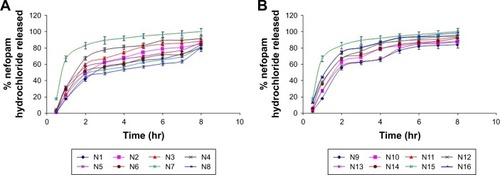
Table 3 Ex-vivo permeation parameters of NF loaded niosomes and free NF (means±SD,Table Footnotea n=3)
Table 4 P-values and estimated effects of the studied responses (n=3)
Figure 3 Light photomicrographs of (A) untreated nasal mucosa of rats and (B) rat mucosa treated with in-situ gel containing optimum NF-loaded niosomes.
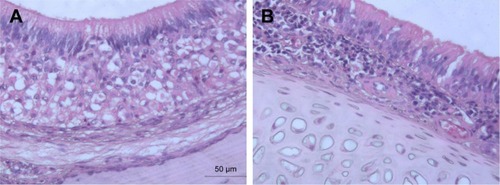
Figure 4 Plasma concentration-time curve obtained after oral administration of a single dose (20 mg/kg) of NF oral solution and intranasal administration of the optimum formulation of NF-loaded niosomes and NF nasal solution to rats (means±SD, n=10).
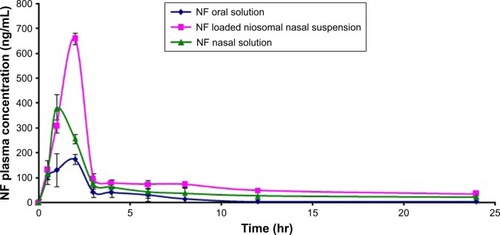
Table 5 Mean pharmacokinetic parameters of the rats following administration of the optimized nasal NF-loaded niosomal in-situ formulation, NF nasal solution, and oral NF solution (means±SD, n=10)
Figure 5 Permeation profiles of NF from NF-loaded niosomes along with NF powder: (A) N1–N8 and (B) N9–N16.
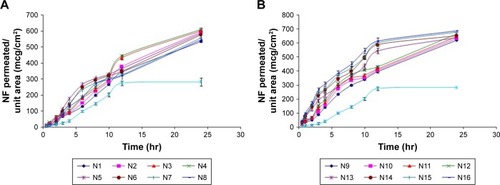
Figure 6 3D response surface plots showing the effect of (A) cholesterol: surfactant ratio and (B) surfactant type on the responses (upper section of graph). Contours of determined response surface plots revealing the relationship between different levels of variables to obtain fixed values of responses (lower section of graph).
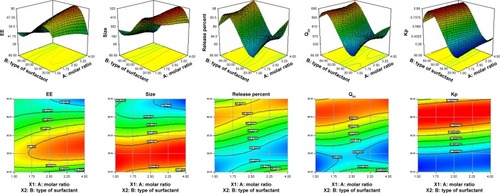
Table 6 Model optimum solution and the calculated values of the expected niosomal formula (n=3)
Figure S1 Flow curve of NF-loaded niosomal in-situ gel after gelation at body temperature.
Figure S2 Rheogram of NF-loaded niosomal in-situ gel after gelation at body temperature.
Table S1 Rheological parameters of the prepared niosomal NF in-situ gel formulae after gelation
Figure S3 Release behavior of NF from NF-loaded niosomal suspension and NF-loaded niosomal in-situ gel (means±SD, n=3).
Figure S4 Permeation profiles of optimum NF-loaded niosomal suspension versus optimum NF-loaded niosomal in-situ gel (means±SD, n=3).
Table S2 Permeation parameters of NF-loaded niosomal in-situ gel versus optimum NF-loaded niosomal suspension